Using Simplified Analytics in Small Form Factor
You can use a small form factor to create, edit, and view the analytic reports.
Note: The Simplified Analytic feature supports the Chart and Simple Table views on small form factor, but this feature does not support Pivot Grid view on smart form factor. The reports that contain Pivot Grid view (created in tablets or desktop) will not show up on small form factor, on the Unified Related Content Analytics pane.
This example shows you how to create, edit, or view the analytics using a small form factor,
Access the fluid component for which you have the Simplified Analytics feature enabled.
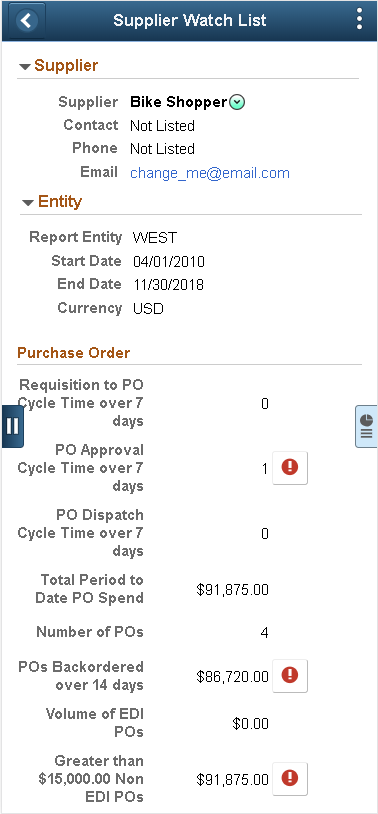
In this example, access the Supplier Watch List component under Procurement Operations.
This example illustrates the Supplier Watch page on a smart phone displaying the details of supplier, purchase order, and entity for supplier Bike Shopper. The Expand icon at the right of the view is used to display the Unified Related Content Analytics pane.
Click the Expand icon at the right of the view to expand the right panel that displays the Unified Related Content Analytics pane. See, Accessing from the Unified Related Content Analytics Pane.
This example illustrates the Supplier Watch page displaying the Unified Related Content Analytics pane on a smart phone. The pane also display related information tiles such as Supplier Performance, Overall Score Trend and so on.
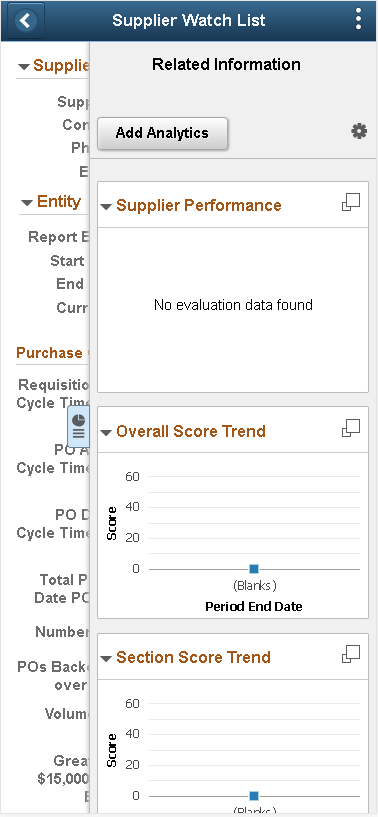
Note: On smart phones, all analytics that have the display option set to Pivot Grid View are suppressed and not listed under the My Analytics section.
Tap the Add Analytics button on the Unified Related Content Analytics pane to create a new simplified analytic.
The Create Analytics Wizard – step 1 appears.
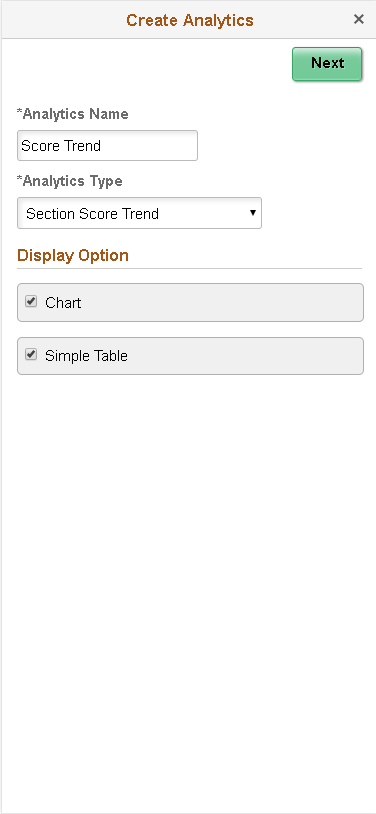
Enter the name of the analytics into the Analytics Name field.
In this example, enter Score Trend.
Select an analytics template from the Analytic Type dropdown list.
In this example, select the Section Score Trend option from the list.
Use the Display Option section to set the chart and table views for the analytics.
Note: Using a smart phone, the available display options are Chart and Simple Table views. The Pivot Grid view is not available.
This example illustrates the Create Analytics Wizard - step 1. The analytic report Non Contract Spend will use the analytic template Non Contract PO Spend. The report will display the results in the Chart and Simple Table view.
Tap the Next button to display the Create Analytics Wizard - step 2.
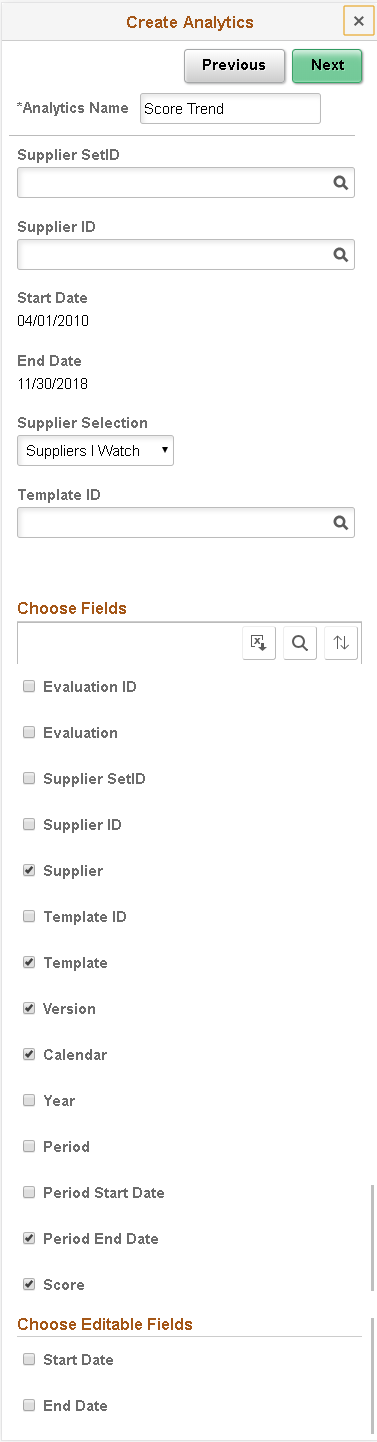
Select the prompt values for the analytics, if any.
Use the Choose Fields section to select the fields that will be available in the analytics. Also use editable fields from the Choose Editable Fields section. See Create Analytics- Step 2.
This example illustrates Create Analytics Wizard - step 2.
Tap the Next button to display the analytics preview window.
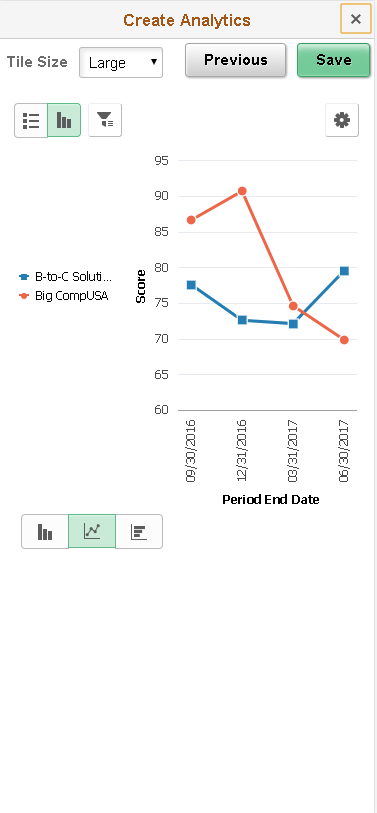
This example shows the preview window of the analytics Score Trend using the analytic template Overall Score Trend.
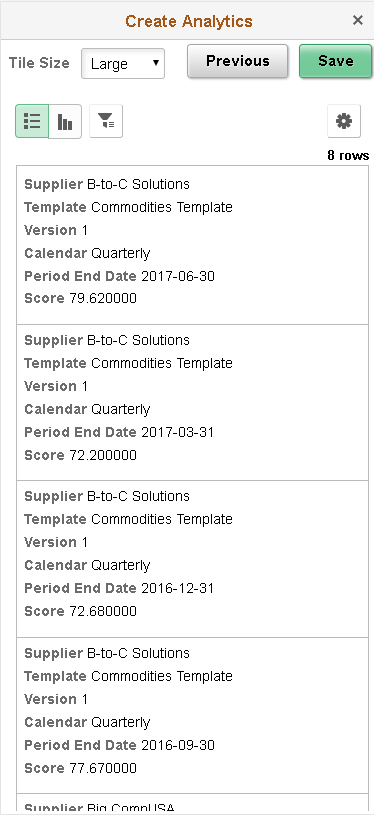
Toggle to List view. Use the List button at the top-left of the chart to view the results in a list.
List view of the analytics.
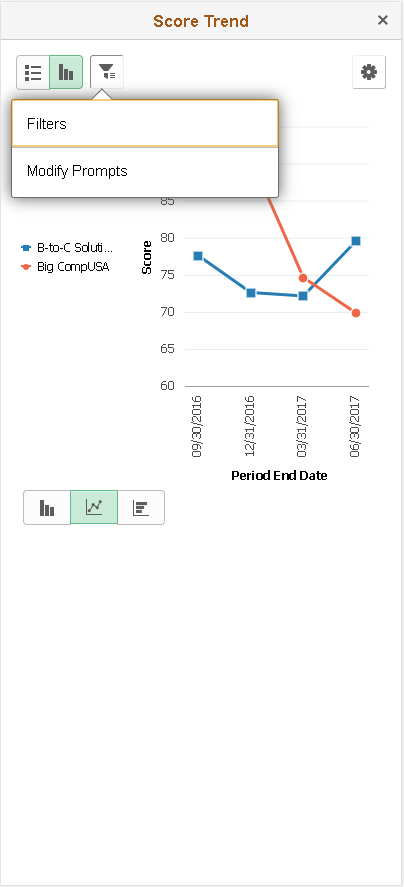
Tap the Filters (funnel) icon at the top-left of the chart to display the filters in a modal window. When you view the analytics, you get the Modify Prompts option too.
This example shows the Filters and Modify Promptsoptions displayed.
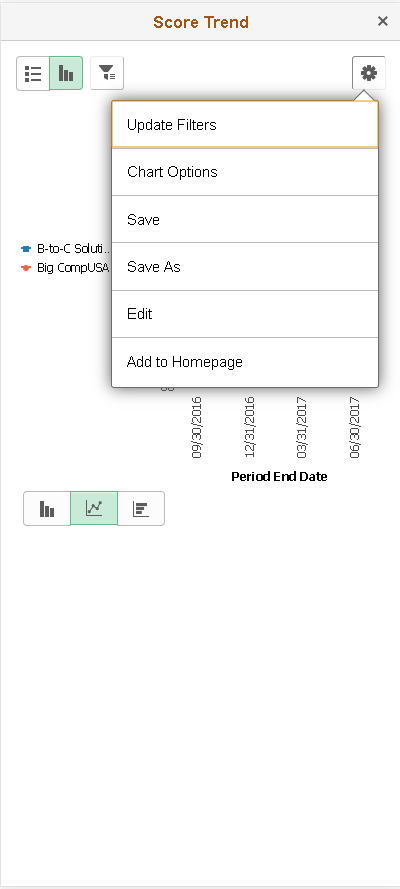
Use the Chart Options from the Options menu to change the chart display options such as X axis, Series, Y axis, and so on.
Note: On smart phones, you cannot use the drag-and-drop function to change the chart axes.
This example illustrates the options from Options menu.
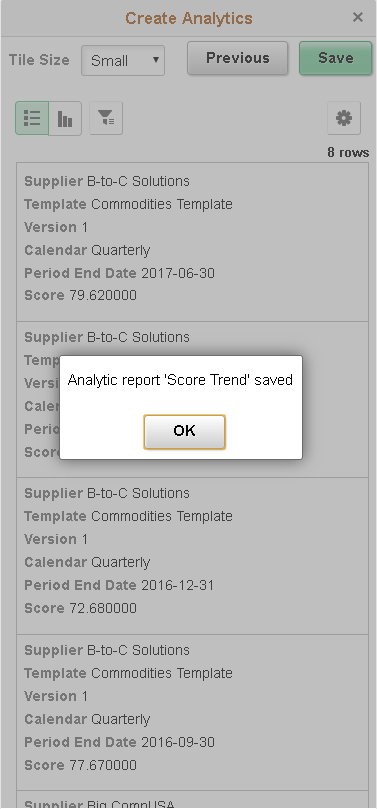
Save the analytic report using the Save button.
This example illustrates the confirmation for saving the analytic report after clicking the Save button.
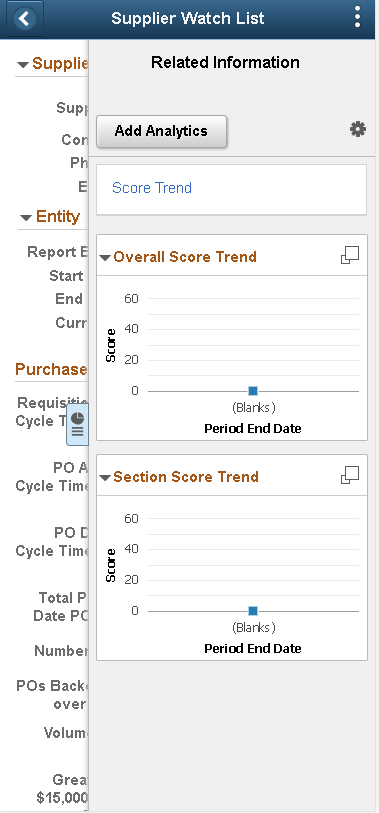
Return to the Supplier Watch page; the Unified related Content Analytics pane lists the analytics with other related information.
This example illustrates the Supplier Watch page displaying the Unified related Content Analytics pane on a smart phone. The Score Trends analytics is available.
Tap the analytics link to view the it in a modal window.
When you view the analytics on small form factor, you are asked to enter values to relevant fields. These fields are configured as runtime prompts for the analytics in the wizard.