Graph Interaction
The Graph Visualization Toolkit (GVT) offers many interactive features that allow users to explore and analyze graph data. Below are some of those features:
Visibility and Styling Highlights
The Visibility and Styling Highlights feature lets users show or hide vertices or edges and control their styling through conditions defined via settings. The settings will get passed to the GVT component in the below JSON format and the component will render vertices, edges, and legend items as visible or hidden and with styling (colors, animations, etc) based on the settings passed. The users can also manually toggle the legend item controls in the legend area and control the visibility and styling of vertices and edges in the graph region.
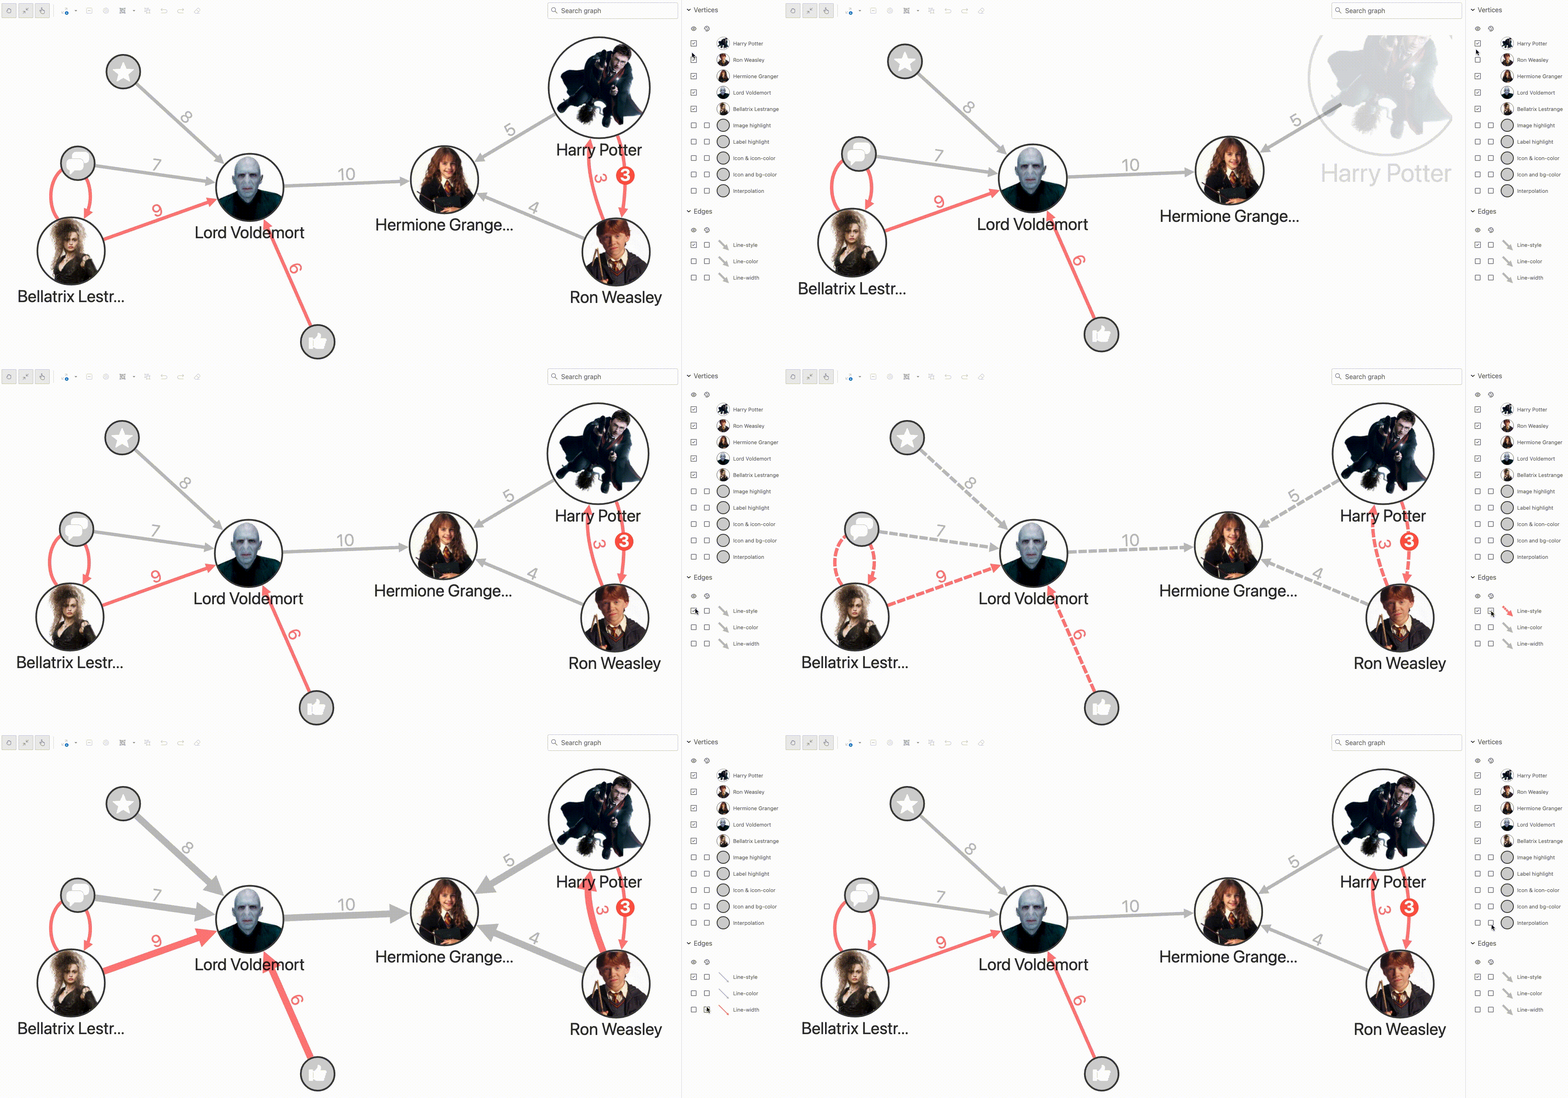
Visibility and styling highlights have separate toggle controls that can be used to control them separately via the legend item. Visibility highlight is implicit in nature and is enabled for all legend items by default, whereas Styling highlight is available only when it is configured via settings.
Settings JSON:
1 2 3 4 5 6 7 8 9 10 11 12 13 14 15 16 17 18 19 20 21 22 23 24 25 26 27 28 29 | |
Aggregation Highlights
The Aggregation Highlights feature allows users to perform aggregate computations on the properties of a vertex group or edge collection. The computation is performed when user invokes tooltip on a vertex group or edge collection; and the tooltip shown displays a summary page with the computation results in it. The consuming application of GVT can let the user configure the aggregation highlights / filters that get subsequently passed to the GVT component via its settings property. GVT will use these highlights/filters to derive the settings used for computations and show the results back to the user inside the first page of the tool-tip.
Vertex Aggregation
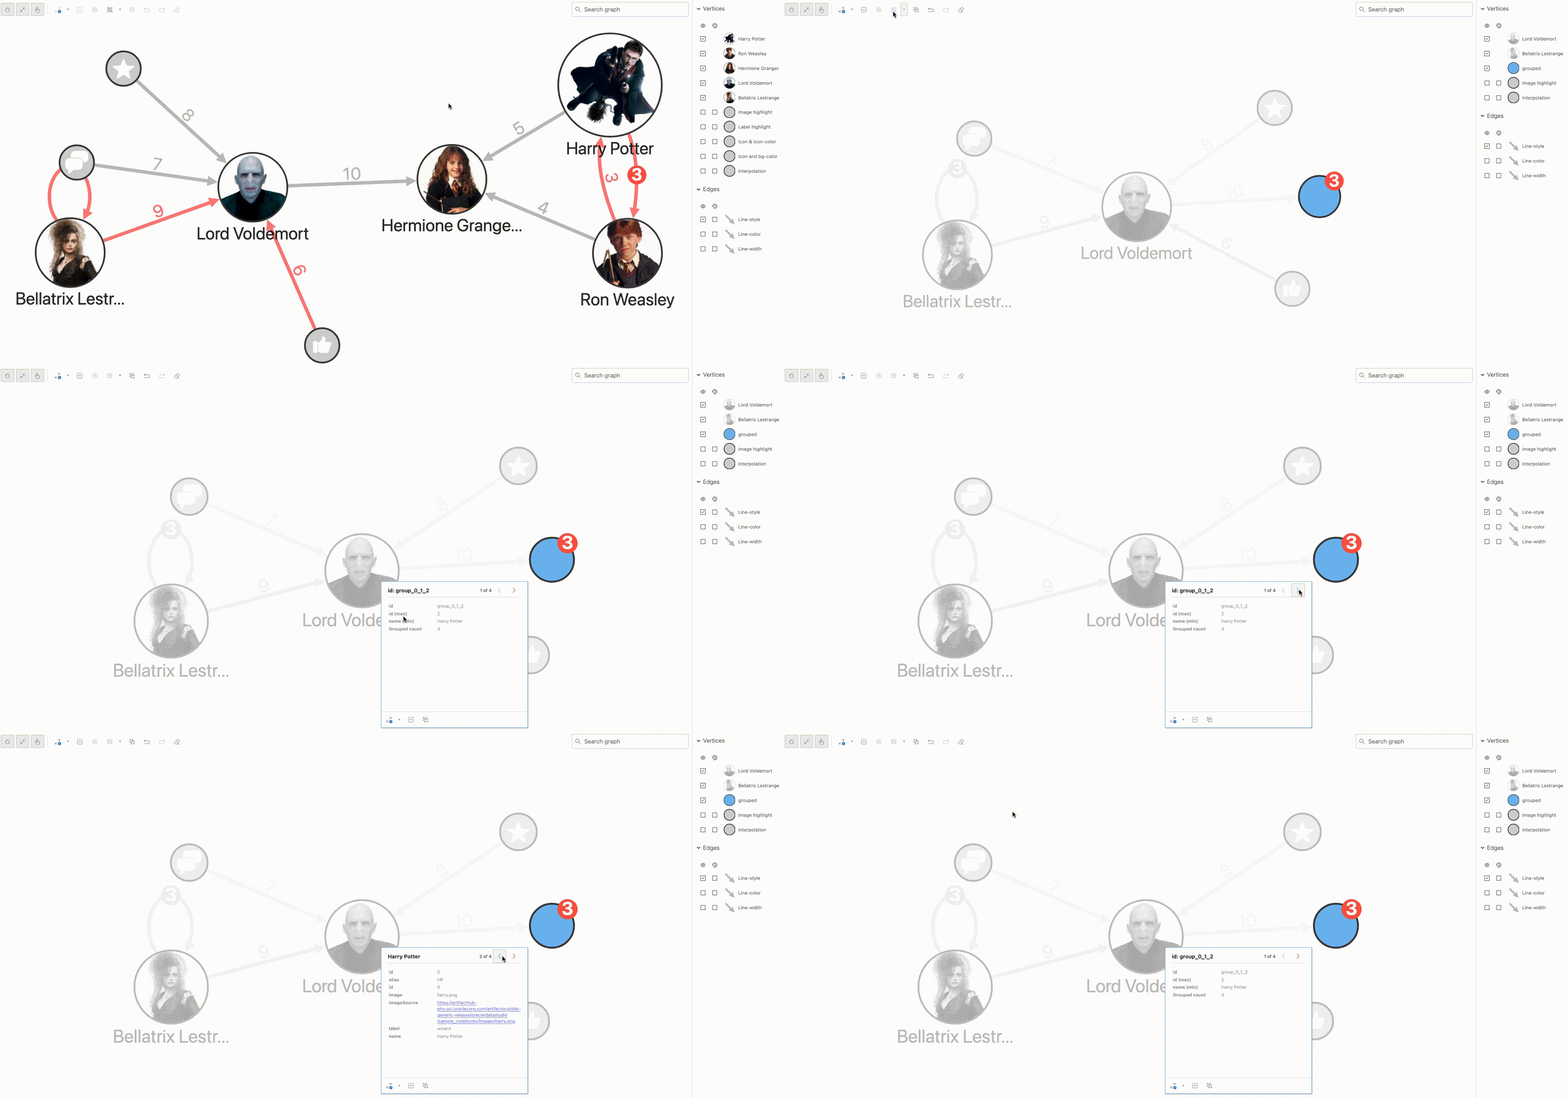
The above GIF demonstrates the use case where 'min' aggregation is computed on the 'name' property and 'max' on the 'id' property of vertices belonging to a group. The condition specified further enforces that the computation is performed only on those vertices having label as 'wizard'. The below JSON depicts this configuration.
Settings JSON:
1 2 3 4 5 6 7 8 9 10 11 12 13 14 15 16 17 18 19 20 21 22 23 24 25 26 27 28 29 30 31 32 | |
Edge Aggregation
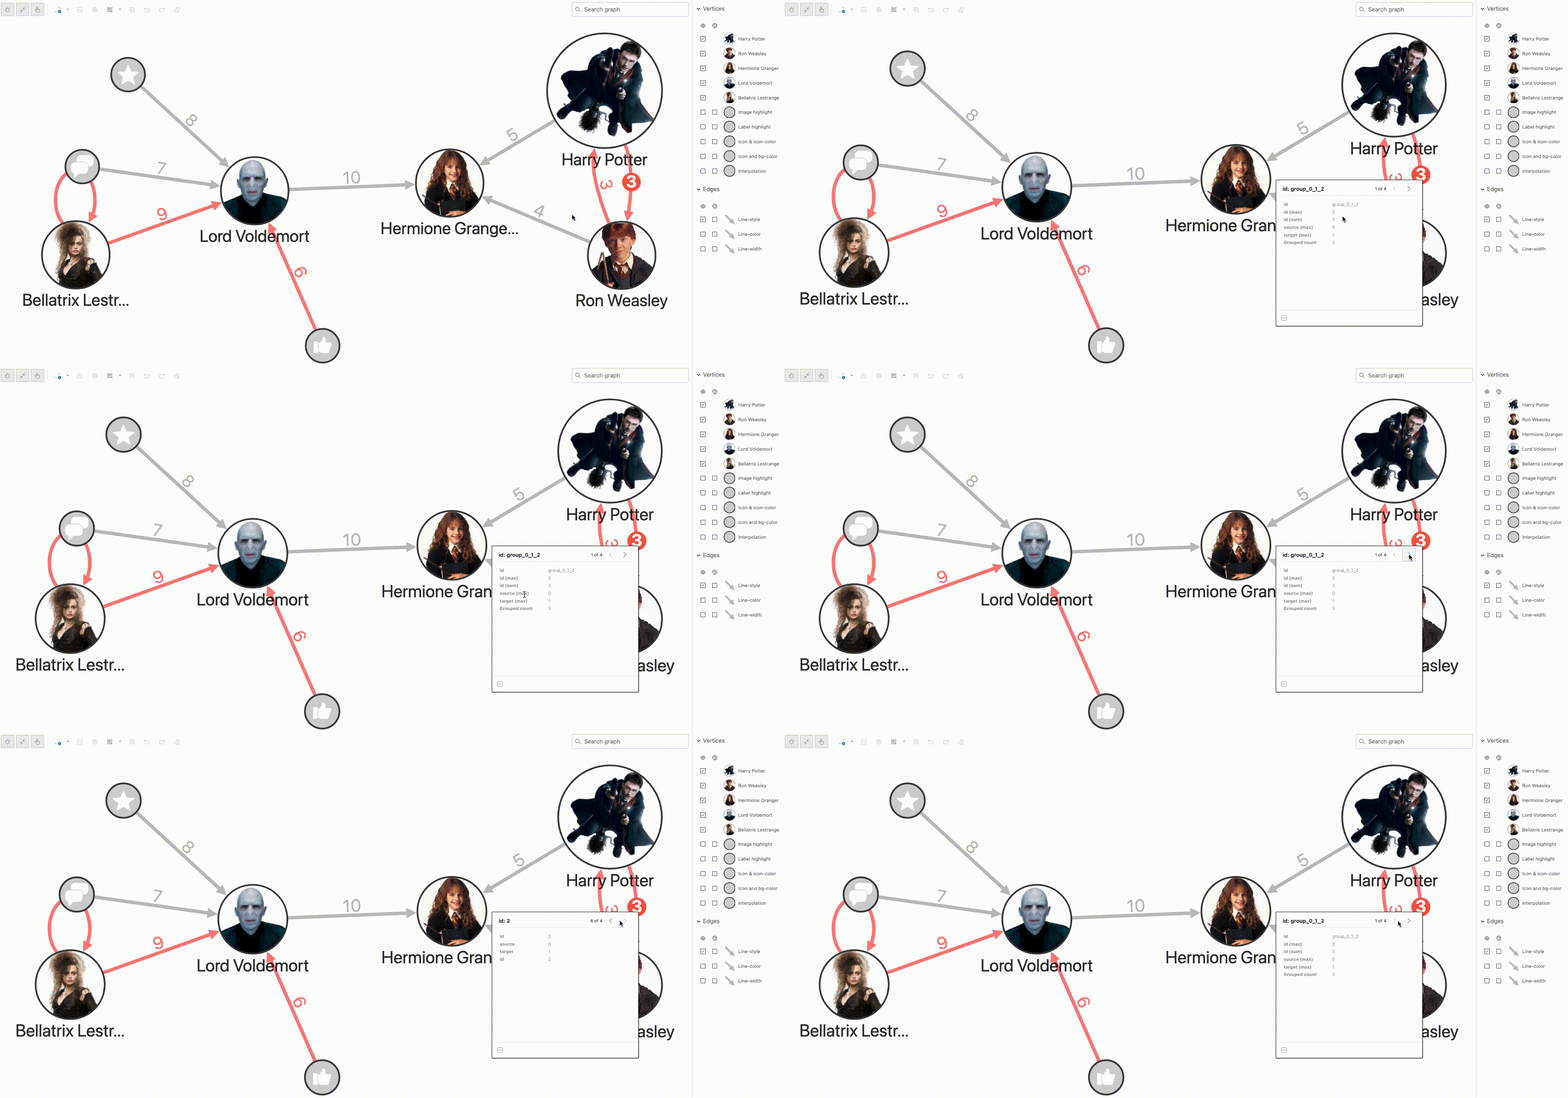
The above GIF demonstrates the use case where 'max' aggregation is computed on all properties, and 'sum' computed on 'id' property of edges belonging to an edge collection. The 'max' aggregation is computed on all properties in the example, since 'source' is configured as empty for that aggregation. The below JSON depicts this configuration.
Settings JSON:
1 2 3 4 5 6 7 8 9 10 11 12 13 14 15 16 17 18 19 20 21 22 23 24 25 26 | |
Smart Expand
The Smart Expand feature gives users the ability to define certain conditions on the properties of vertices/edges, based on which the graph will get expanded. Smart expand will fetch only those neighbors that meet the conditions specified.

This GIF illustrates the Smart Expand feature. The user can click the Arrow button to trigger a menu through which the user can pick the required Smart expand option. Each smart expand option has conditions configured. For instance, the second option in the figure, "Expand By Age," has a condition saying 'Age should be greater than 10 and the maximum number of hops should be 5'. With the vertex to be expanded selected in the graph, when the user choose the required smart expand option from the toolbar or from the tooltip, the graph expansion happens. The graph will expand to render the neighbors of the selected vertex, that satisfy the conditions defined in the chosen smart expand option, such as in the case of "Expand By Age".
Smart Expand not only expands the vertices but also loads more vertices and edges into memory. This means that the Smart Expand action actively retrieves and adds additional related data to the currently loaded graph, enhancing the available information for analysis or processing purposes.
Overall, the Smart Expand feature provides a flexible way to navigate and expand vertices based on specific conditions, while also dynamically loading more data when required.
Smart Group
The Smart Group feature allows users to group vertices that satisfies specified conditions on graph properties. The conditions can include:
1. vertices that match certain vertex conditions
2. vertices are connected to each other with an edge fulfilling certain edge condition.
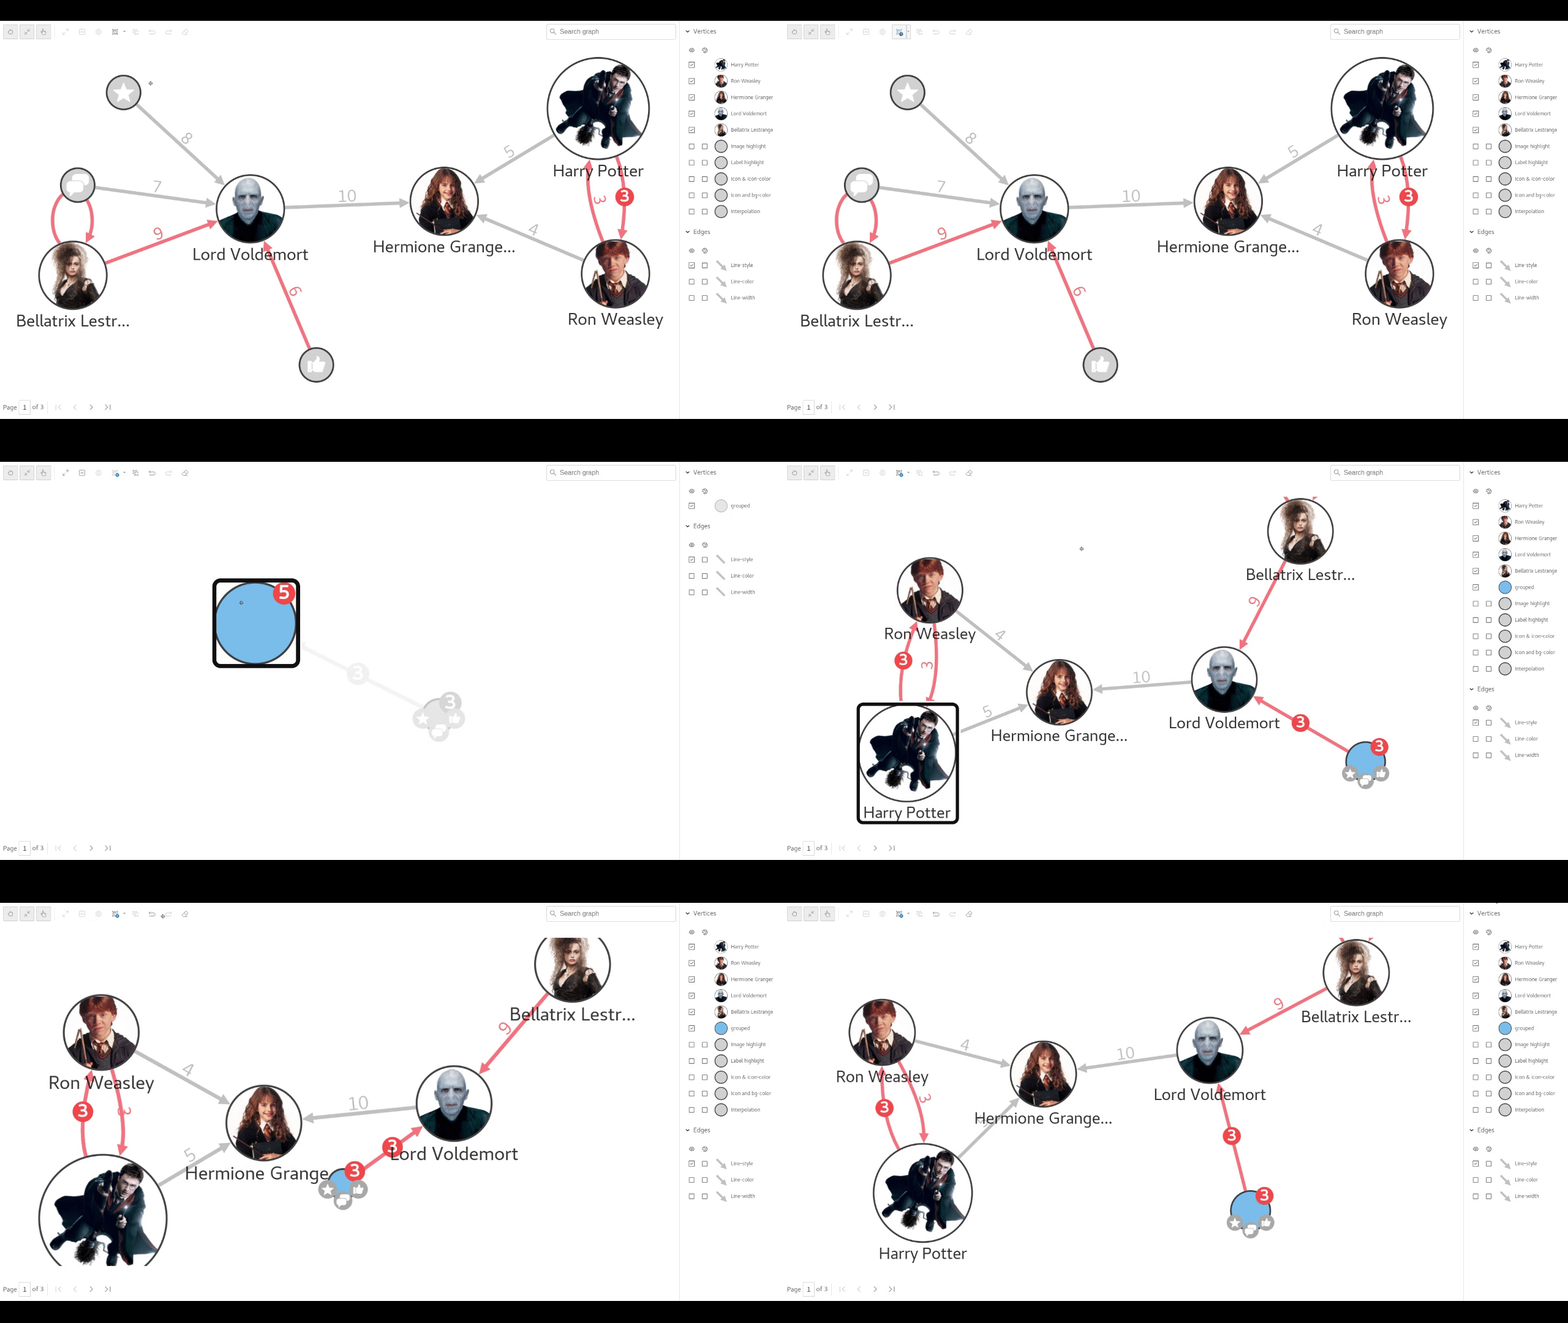
The above GIF illustrates the 'Manual Smart group' feature. User can expand the drop down button and pick the smart group of their choice from smart group options menu. As the user proceeds to click the group button, grouping of vertices happens based on the chosen smart group option.
Smart group options are passed into GVT via the smart group settings, and are filtered based on the setting's property 'automatic' = false. For e.g. In the GIF above, GVT is passed with smart group setting with automatic='false' and groupBy = 'label' (configured using the consuming application's settings UI for instance). When the user picks the smart group option of the user's choice from the drop down menu, and click the group button, those vertices with label as 'icon' and 'wizard' will be grouped into two distinct groups.
The smart group feature fits into the current graph actions flow, that enables users perform redo/undo on grouping related actions.
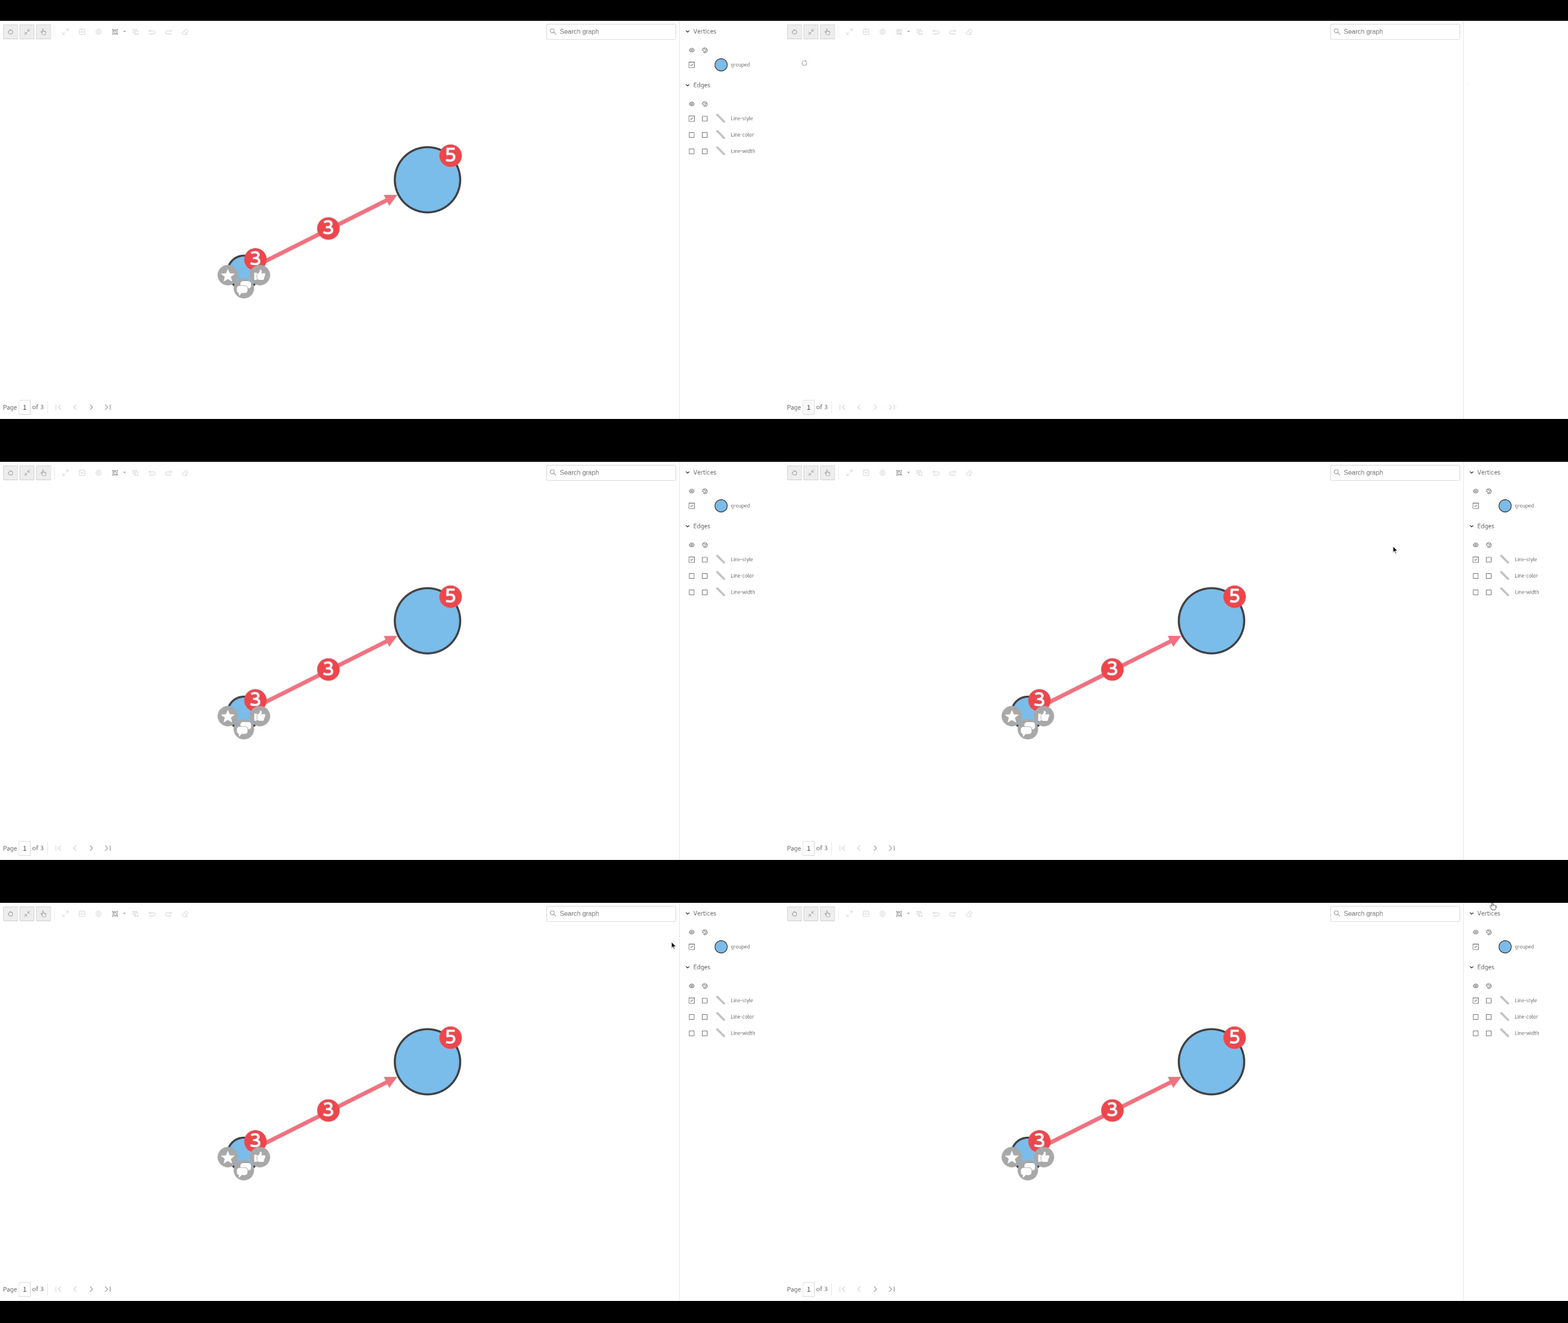
The above GIF illustrates the 'Automatic Smart group' feature. The user can edit and activate smart group option using the consuming application's settings UI for instance. The smart group options are passed into GVT with 'smart group' settings and are filtered by the setting's property 'automatic' = true. For e.g. In the GIF, GVT is passed with smart group setting with automatic='true' and groupBy='label' and those vertices with label as 'icon' and 'wizard' will be grouped into two groups instantly after loading the graph.
Search
The Search feature allows users to type in a search keyword and find the matching vertices and edges among the graph nodes. The vertices and edges that match the user input gets highlighted, making it easier for the user to locate them in the graph region. GVT offers a search field to capture keyword and initiate search, a built-in search logic that can identify and highlight matching vertices or edges from the graph data, and the option to let the consuming application externalize the search logic.
Built-in Search :
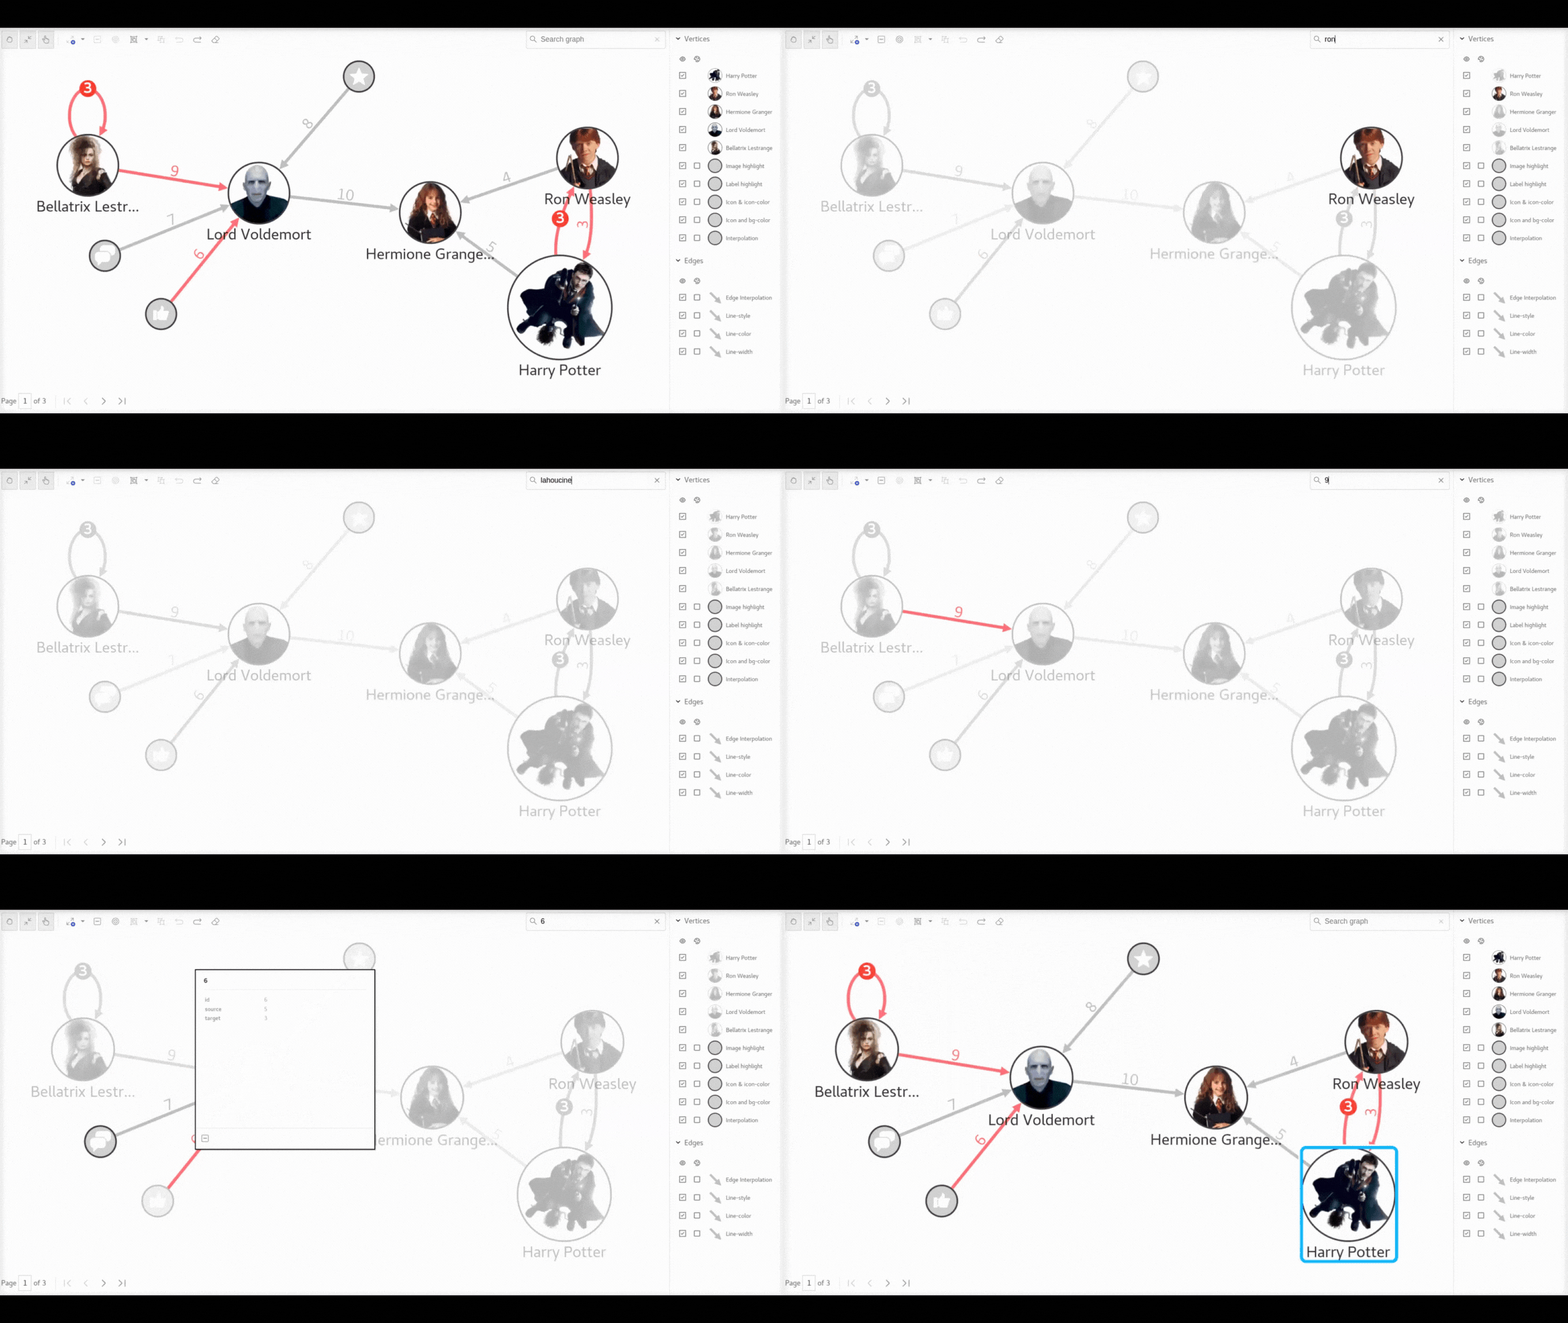
The GIF above demonstrates the built-in search facility offered by GVT. In cases where the consuming application hasn't implemented custom search logic, GVT will default to the built in search logic. In this mode, when the user initiates a search in the keyword field, GVT performs a 'starts with' comparison using the keyword, on the attributes of all vertices and edges in the graph. The matching vertices/edges are then highlighted inside the graph region.
External Search :
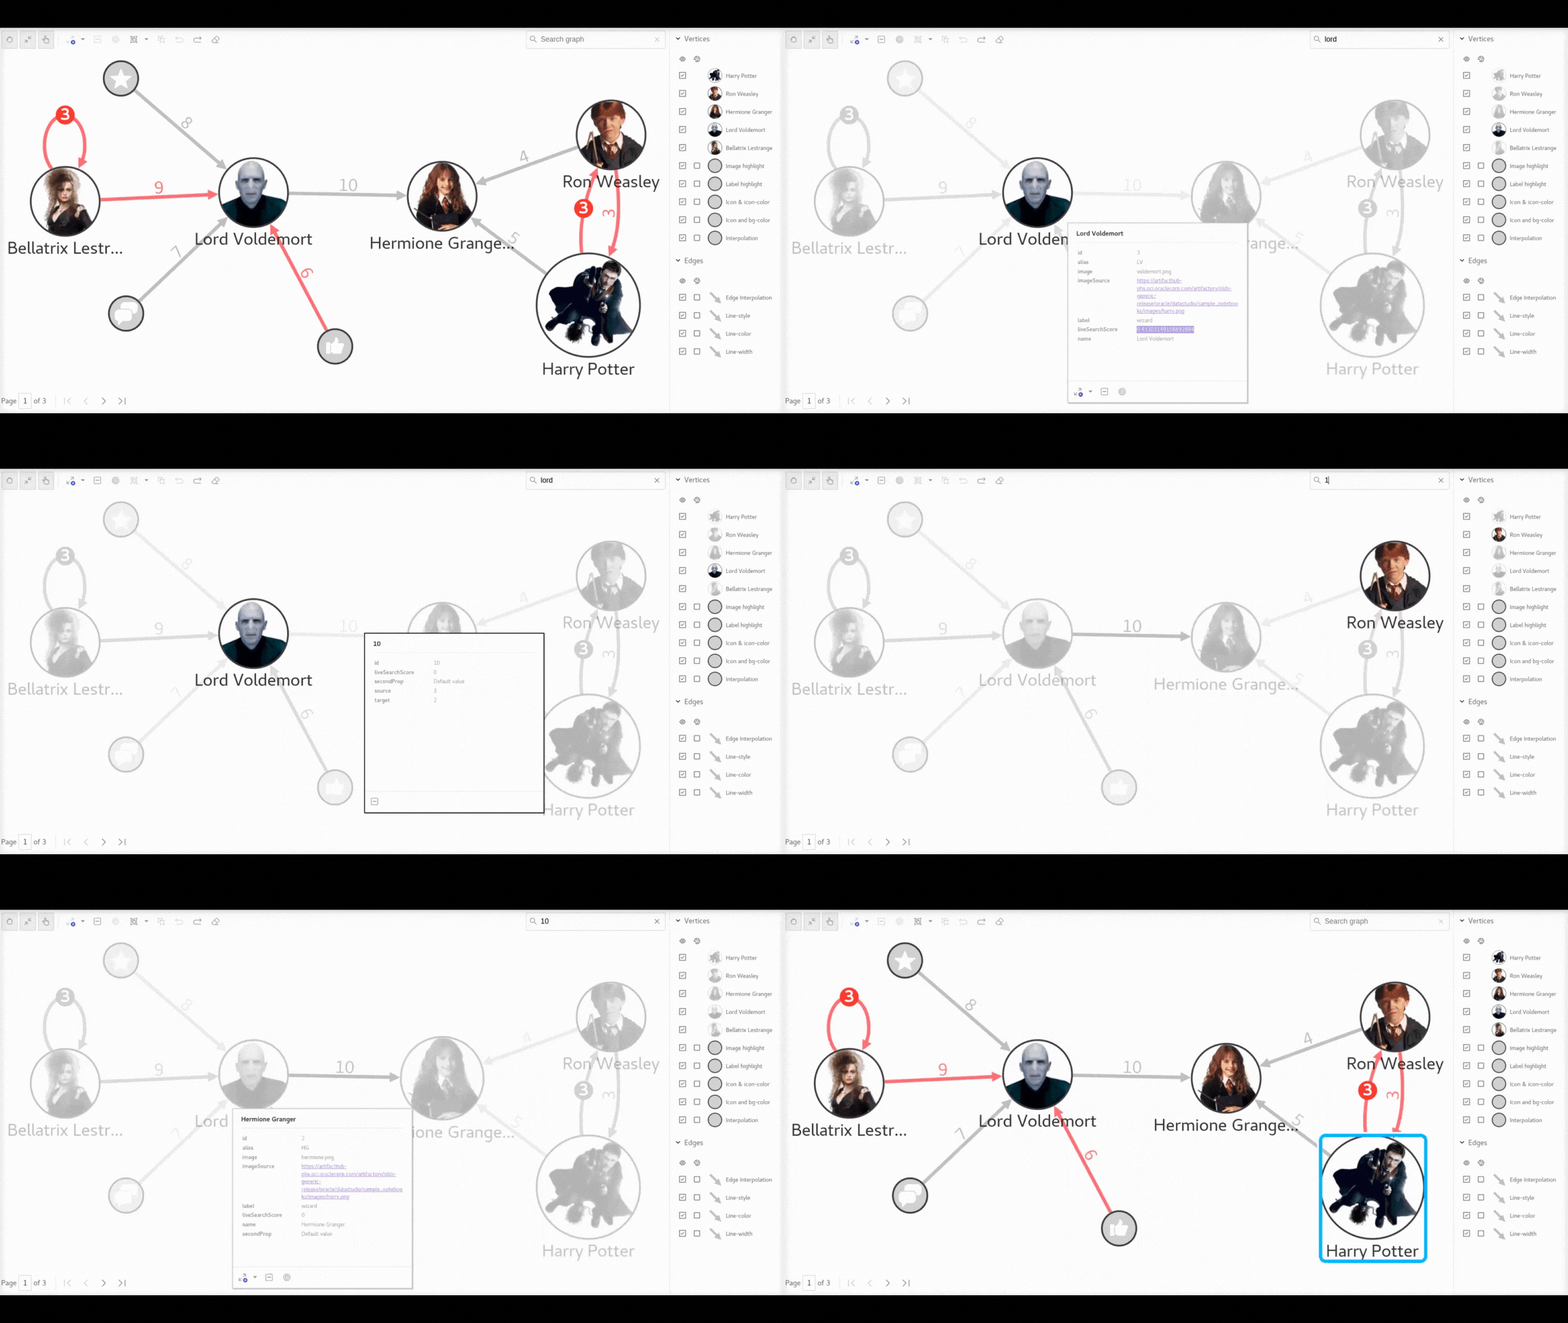
The above GIF depicts the usage of external search logic. In scenarios where the consuming application provides external search logic, and as the user triggers search, GVT will send the search keyword captured to this external search method. The implementation of the actual search logic within this custom handler method lies with the consuming application. As the search concludes and the method returns the results back, GVT will highlight the vertices / edges in the result inside the graph region.
Additionally, the external search logic can include extra properties in the vertices/edges returned as the search result. These additional property values will be displayed inside tooltips triggered on those vertices/edges, and can also be used to define highlights.