4.2.1 スタンドアロンMapLibre JavaScriptマップでのSpatial Studioデータセットのベクター・タイルとしての表示
この項では、オープン・ソースのMapLibre GL JS APIライブラリを使用して記述されたスタンドアロンのJavaScript Webマッピング・アプリケーションで、データセットのベクター・タイルを表示できる単純な1ページのHTMLページを作成する方法について説明します。
マッピングAPIはいずれも、次の基準を満たす必要があります:
- 外部ソースからのベクター・タイルまたはGeoJSONデータの表示をサポートします。
- ベクター・タイルまたはGeoJSONリクエストでのカスタムHTTPヘッダーの設定をサポートします。
これは、アクセス・トークンをSpatial Studioに渡すために必要です。
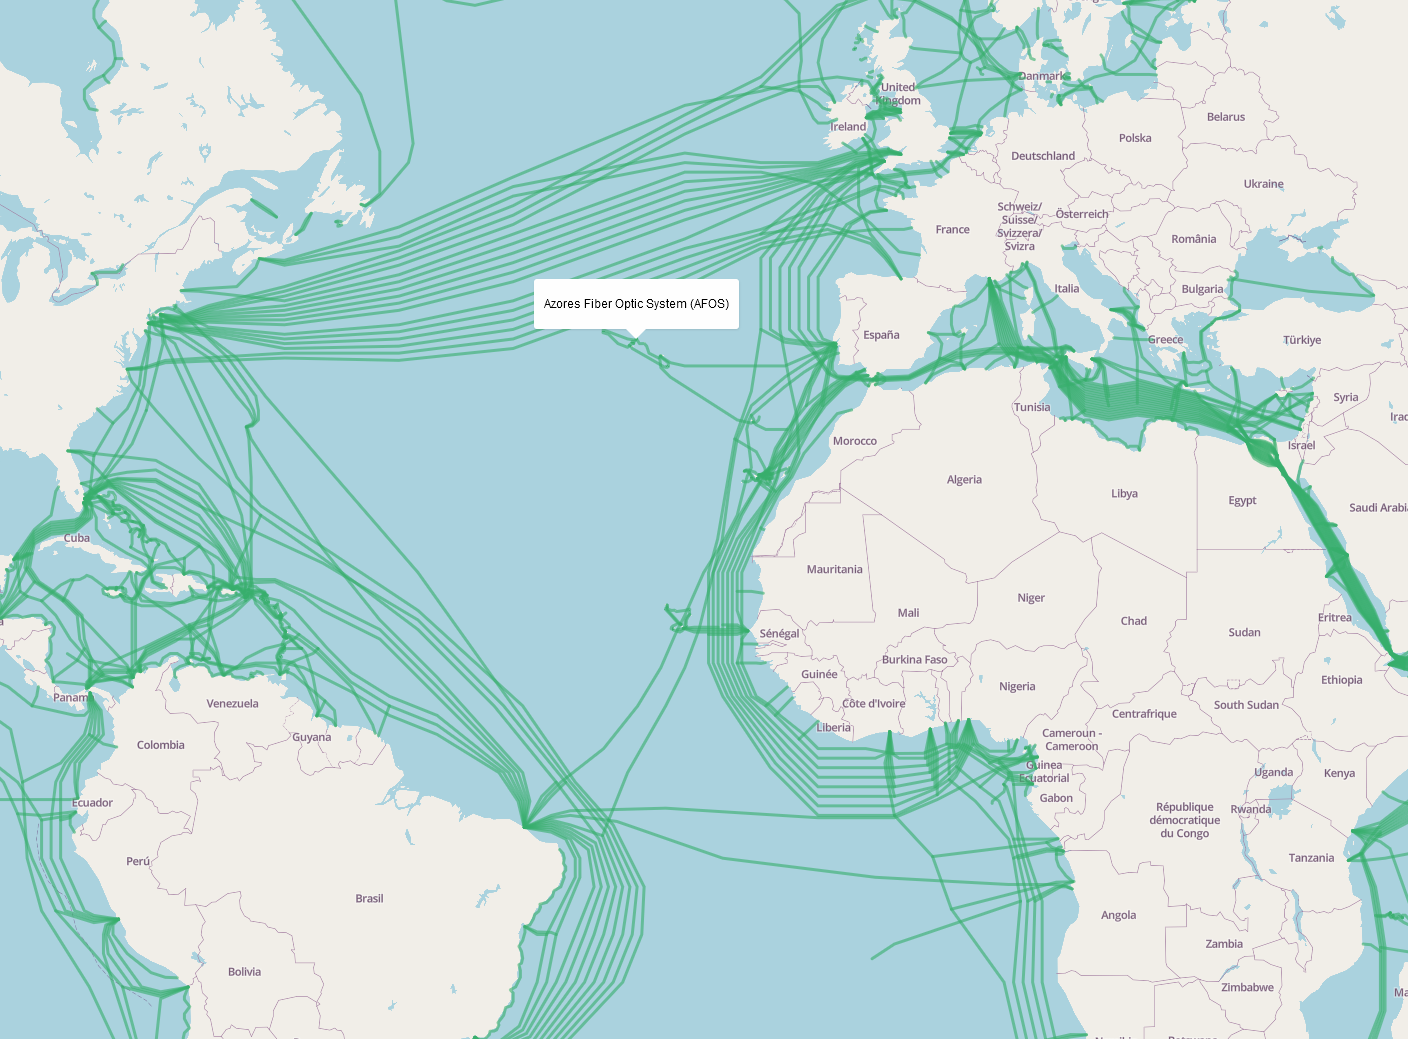
次の例では、Spatial Studioデータセットの作成元となったOracleデータベース表にロードされたパブリック・データセットSubmarine Cablesを表示します。アクセス・トークンは、タイプが「データセットのストリーミングのみ」の同じStudioサーバーから取得されました。サンプル・コードは次のとおりです:
<!DOCTYPE html>
<html lang="en">
<head>
    <meta charset="utf-8">
    <title>Display vector dataset from Spatial Studio</title>
    <meta name="viewport" content="initial-scale=1,maximum-scale=1,user-scalable=no">
    <script src="https://unpkg.com/maplibre-gl@2.1.9/dist/maplibre-gl.js"></script>
    <link href="https://unpkg.com/maplibre-gl@2.1.9/dist/maplibre-gl.css" rel="stylesheet">
    <style>
        body { margin: 0; padding: 0; }
        #map { position: absolute; top: 0; bottom: 0; width: 100%; }
    </style>
</head>
<body>
<div id="map"></div>
<script>
    const spatialStudio = {
        // the base URL for accessing Spatial Studio dataset's vector tiles using an access token
        baseUrl : 'https://localhost:4040/spatialstudio/oauth/v1',
        // a stream-only access token issued by Spatial Studio
        accessToken: 'eyJ0eXAiOiJzZ3R...HV3koQsYF_MkKQ'
    };

    const map = new maplibregl.Map({
        container: 'map',
        // For demo purpose we will simply create a background map based on the OpenStreetMap from Map Tiler. Note that you must obtain your own API key from maptiler.com. Any Mapbox style basemap works here.
        style: ' https://api.maptiler.com/maps/openstreetmap/style.json?key=YOUR_KEY',
        zoom: 1,
        center: [-122.5, 37.5],

        // This function is used to set the Spatial Studio access token when requesting the vector tiles of a dataset.
        transformRequest: (url, resourceType) => {
            if (resourceType === 'Tile' && url.startsWith(spatialStudio.baseUrl)) {
                return {
                    url: url,
                    headers: {'Authorization': 'Bearer ' + spatialStudio.accessToken}
                }
            }
        }
    });

    map.on('load', function () {
        // Adds the vector tiles for the Spatial Studio dataset with the id "c5e166cdf86a1605ff9fbaa9d04b7378" to
        // the MapLibre map as a source object.
        map.addSource('spatial-studio-vector-tiles', {
            'type': 'vector',
            'tiles': [
                spatialStudio.baseUrl + '/vt/c5e166cdf86a1605ff9fbaa9d04b7378/GEOM/{z}/{x}/{y}.mvt'
            ],
            'minzoom': 0,
            'maxzoom': 10
        });

        // Adds the layer definition for the dataset. Note that vector tiles generated by Spatial Studio always includes only one dataset,
        // and the layer name is always 'LAYER'.
        map.addLayer(
            {
                'id': 'submarine-cables',
                'type': 'line',
                'source': 'spatial-studio-vector-tiles',
                'source-layer': 'LAYER',
                'layout': {
                    'line-cap': 'round',
                    'line-join': 'round'
                },
                'paint': {
                    'line-opacity': 0.6,
                    'line-color': 'rgb(53, 175, 109)',
                    'line-width': 3
                }
            }
        );
    });

    map.addControl(new maplibregl.NavigationControl());

    // Adds a simple popup on hover
    var popup = new maplibregl.Popup({
        closeButton: false,
        closeOnClick: false
    });

    // Defines what happens when you mouse over a feature of the dataset.
    map.on('mouseenter', 'submarine-cables', function (e) {
        // Changes the cursor style as a UI indicator.
        map.getCanvas().style.cursor = 'pointer';

        var coordinates = e.features[0].geometry.coordinates.slice();
        if (Array.isArray(coordinates[0])){
            // Uses the first vertex of the linestring feature under hover as the anchor point for the popup.
            coordinates = coordinates[0];
        }

        // NAME is one of the columns of the dataset. You have access to all the columns of a dataset here.
        var description = e.features[0].properties.NAME;

        // Ensures that if the map is zoomed out such that multiple
        // copies of the feature are visible, the popup appears
        // over the copy being pointed to.
        while (Math.abs(e.lngLat.lng - coordinates[0]) > 180) {
            coordinates[0] += e.lngLat.lng > coordinates[0] ? 360 : -360;
        }

        // Populates the popup with custom HTML contents and sets its coordinates
        // based on the feature found under the mouse pointer. Finally the popup is added to the map.
        popup.setLngLat(coordinates).setHTML(description).addTo(map);
    });

    map.on('mouseleave', 'submarine-cables', function () {
        map.getCanvas().style.cursor = '';
        popup.remove();
    });

</script>

</body>
</html>
前述のコードに関連する次の点に注意してください:
baseURLおよびaccessTokenは、ご使用のインストールにあわせて置き換えます。また、アクセス・トークンのタイプは「データセットのストリーミングのみ」である必要があります。- 同様に、データセット
id文字列を独自のものに置き換えます。 - アクセス・トークンは、MapLibre
Mapオブジェクトの作成時に、MapLibre APIのtransformRequestオプションを使用してリクエスト・ヘッダーとして設定されます。このオプションは、ベクター・タイル・リクエストをSpatial Studioサーバーに送信するたびに呼び出されるコールバックをMapLibre APIに提供します。 - MapLibre vectorタイプのソース・オブジェクトが作成され、その
Mapオブジェクトに追加されます。このソース・オブジェクトからマップ・レイヤーが定義され、マップにも追加されます。 - データがマップに表示されると、データセットのすべての列にフル・アクセスできます。
- ポップアップ動作およびコンテンツは標準のMapLibre GL JS APIクラスであるため、いつでもカスタマイズできます。
コードをWebサーバーに保存し、そのURLをブラウザ・ウィンドウで開くと、次のようなマップが表示されます。マップの緑色の線は、海底ケーブルが含まれるSpatial Studioデータセットのフィーチャです。
