Configuring and Reviewing Advisories
Use the Advisory Settings page (ECL_ENVRECM_SET_FL) to configure or update advisory settings for an environment.
Using Advisories includes the following high-level steps:
The Cloud Manager administrator enables advisories globally on the Cloud Manager Settings > Advisory Settings page.
The advisories feature works only for environments with tags.
The environment owner enables advisories for a provisioned environment.
See Enabling Advisory Settings in this section.
When an advisory notification appears on the environment card, the environment owner accesses the list of advisories and takes appropriate action.
See Receiving Advisory Notifications in this section.
|
Advisory Type |
Description |
|---|---|
|
Infrastructure CPU |
Apply Infrastructure CPU patches immediately or schedule a policy. There is no expiration date for the Infrastructure CPU advisor. |
|
Midtier scaling |
Weekly advisory concerning mid-tier usage. Midtier scaling advisories include an action to create a policy. These advisories expire every week. |
|
Application Level |
Review reports of application errors and application crashes. These advisories expire after a day. |
|
Server Level |
The Server Level advisory is triggered when the available boot volume percent for the environment drops below a specified level. These advisories expire after a day. |
There is a recurring job (ECL_GEN_RECM) and a cron job for generating advisories, which serve the following purposes:
Expire the generated advisories on the expiry date.
Generate new advisories.
Enabling Advisory Settings
By default, advisories will be enabled for all advisory types for the environment. If you want to update advisory settings for the environment, click the Related Actions icon for the environment and select Details. Select Advisory Settings from the left panel.
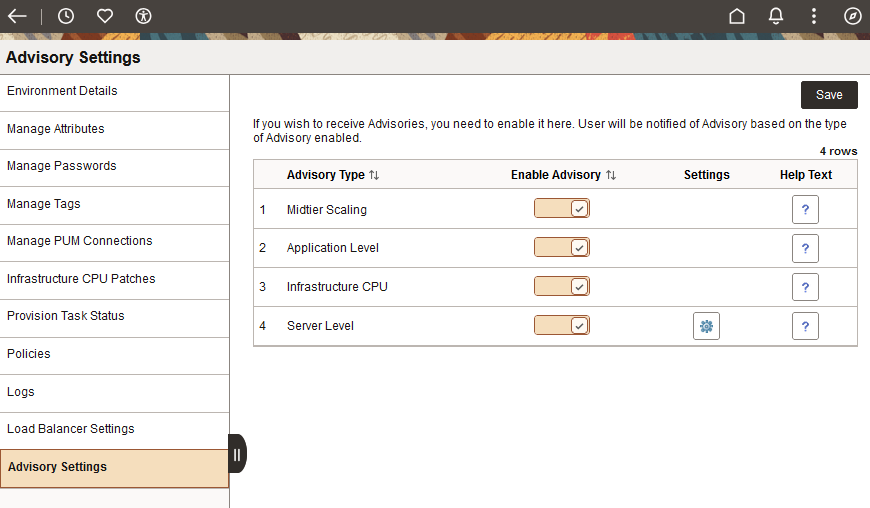
This example illustrates the fields and controls on the Environments > Advisory Settings page. Definitions for the fields and controls appear following the example.
|
Field or Control |
Description |
|---|---|
|
Advisory Type |
Displays the type of advisory to be enabled or disabled.
|
|
Enable Advisory |
Select this option if you wish to receive notifications with advisories for the respective advisory type. |
|
Settings |
Click to display a Settings dialog box to enter the boot volume threshold. |
|
Help Text |
Hover over the icon to view the help text that describes the action that happens on enabling advisory. |
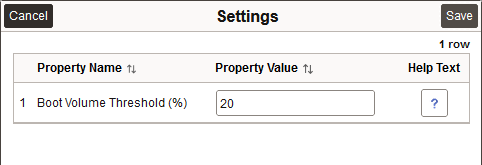
Click the Settings icon for the Server Level advisory and enter a value for the boot volume threshold percentage. When the available boot volume space drops below this percentage, an advisory is generated.
This example illustrates the Settings dialog box for Server Level advisories.
Receiving Advisory Notifications
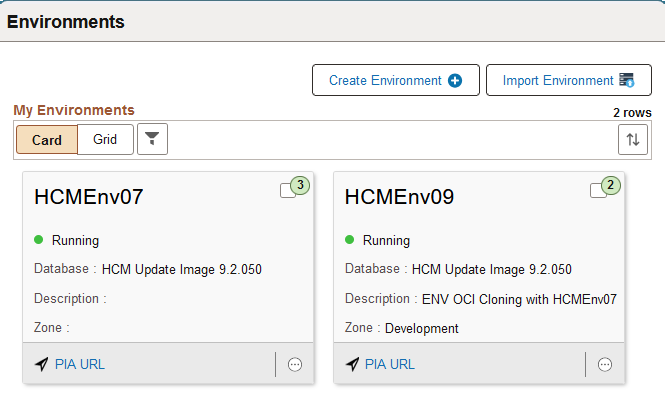
The advisory is indicated as a badge counter on each environment card. The badge is not displayed if there are no advisories associated with an environment.
This example illustrates the badge counter, in the top right corner of each card, for advisories on the Environments page.
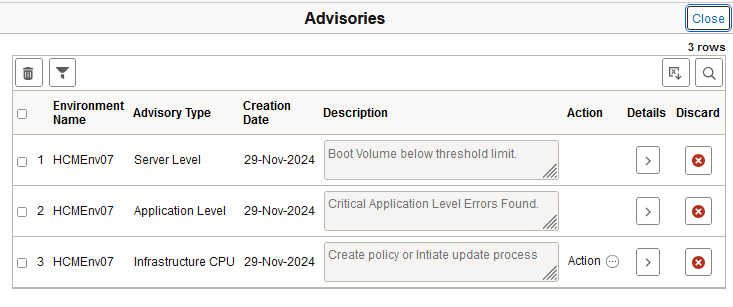
Clicking the badge displays all advisories available for the environment. You can then take appropriate action based on the type of advisory generated. More information is included in the following sections.
This example illustrates the Advisories page with three advisories.
|
Field or Control |
Description |
|---|---|
|
Action |
Click for a menu with available actions.
|
|
Details |
Click to review a detailed report generated by the advisory and the advisory history. |
|
Discard |
Click to delete the advisory. |
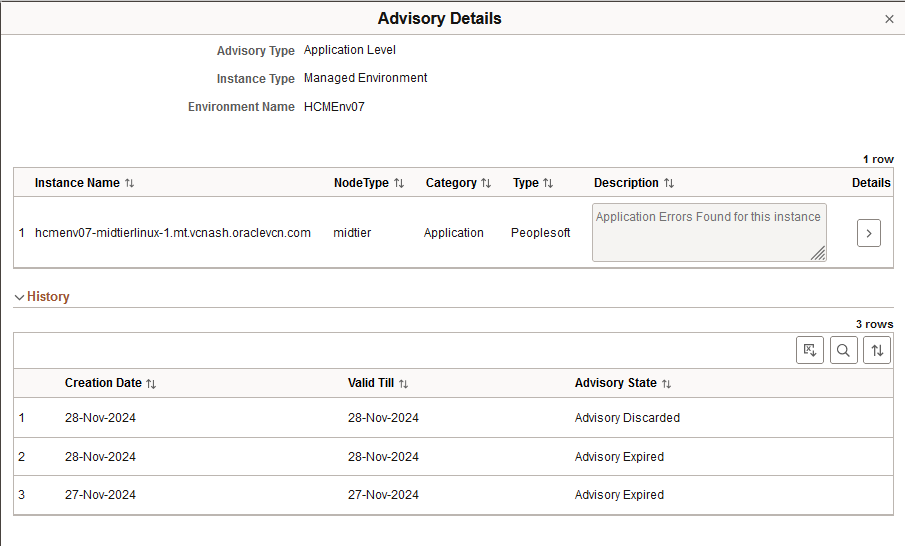
Expand the History section on the Advisory Details page to see the date through which the advisory is valid. The section lists any advisories that are not available for review or which have been acted upon. Here are the Advisory States that are included:
Advisory Action Initiated
Advisory Expired
Policy Created Through Advisory
Advisory Discarded
Using Application Level Advisories
Application Level Advisories are generated for issues such as application crashes or errors. To see a description of the issue, click the Details icon. You can also drill down for more details.
This example illustrates the Advisory Details page for Application Level.
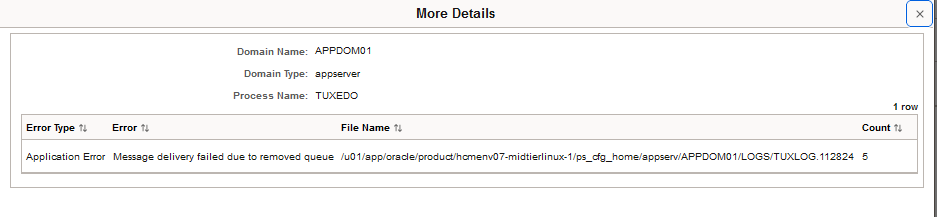
Click the Details icon in the grid at the top to see the More Details page. The page includes:
The domain where the issue occurred, such as application server, Process Scheduler, or web server (PIA).
The name of the process affected by the error.
A more complete error description.
The complete path to a file, such as a log file for application errors, or a core file for application crashes.
This example illustrations the More Details page for an Application Level Advisory.
Using Midtier Scaling Advisories
This example illustrates the action available for Midtier Scaling Advisory.
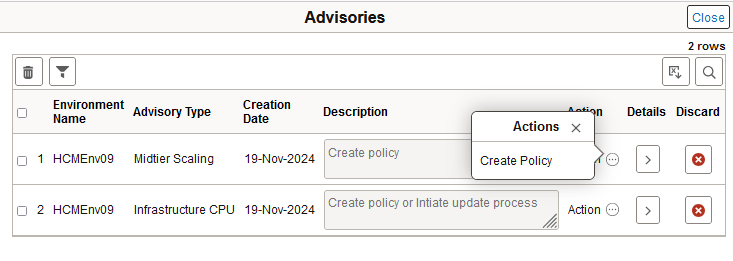
The mid-tier scaling advisory applies to environments that have monitoring enabled and forecasting data present. Cloud Manager provides a weekly advisory for middle tier resources. A mid-tier scaling policy is created for a specific environment.
If you choose to accept the advice to create a new policy, selecting the corresponding action on the Actions field redirects you to the Policy Editor page. See Using Policy Editor.
If a policy already exists, Cloud Manager auto updates the existing forecast data with new forecast data. This policy needs to be recurring, so you must select the recurrence (Environment Midtier Scaling) or set up a custom recurrence under “Schedule”.
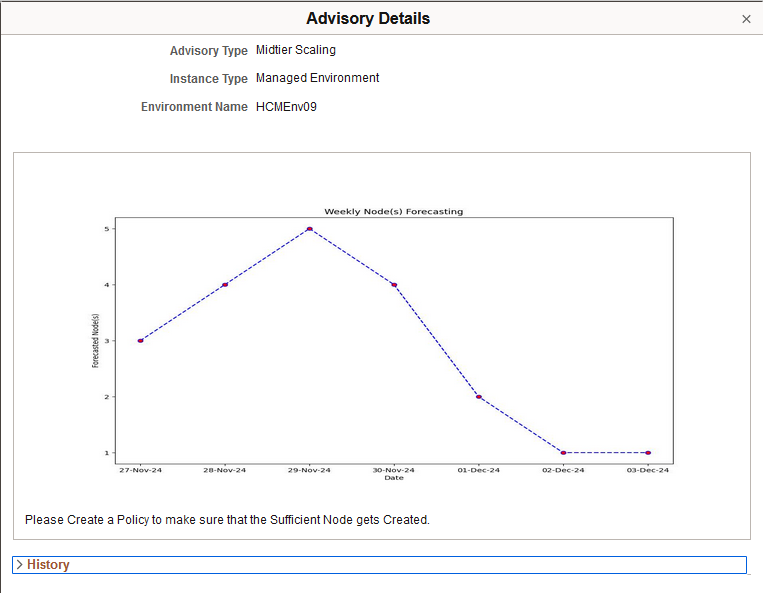
On clicking the Details icon, Cloud Manager displays advisory details for the respective environment. The x-axis denotes weekly node forecasting and the y-axis denotes forecasted nodes. The values for each day in the week match the values for parameters Day 01 (Monday) to Day 07 (Sunday) in Policy Action Parameters. See Using Policy Editor.
This example illustrates the Advisory Details page for Midtier Scaling for the selected environment.
Using Infrastructure CPU Advisories
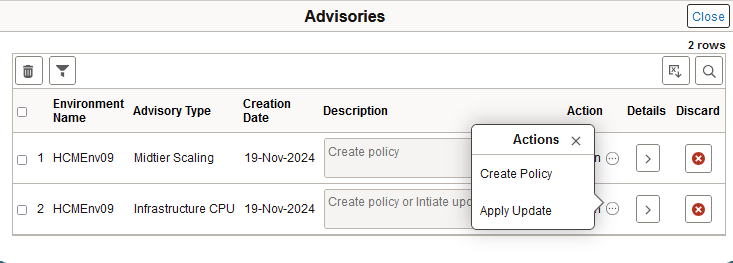
An Infrastructure CPU advisory is generated when an Infrastructure CPU patch is available in the repository. There are two actions available — Create Policy and Apply Update.
This example illustrates the actions available for an Infrastructure CPU advisory.
When you receive an Infrastructure CPU advisory, you can apply the Infrastructure CPU update immediately, or create a policy to apply it later. If you choose to apply the Infrastructure CPU update immediately, select Apply Updates. It will take you to the Infrastructure CPU page in Environment Details. See Applying Infrastructure CPU Patches.
Select Create Policy if you choose to apply the Infrastructure CPU update later. If there is no existing policy, selecting the Create Policy option displays the Policy Editor page. You can review the prefilled policy and click Save to create the policy. You can create a policy with a policy action schedule, which will apply the Infrastructure CPU updates at a specific date and time. If you do not set up a policy action schedule, the policy applies the Infrastructure CPU updates immediately upon download. An Infrastructure CPU policy is created for a specific PeopleTools release such as PeopleTools 8.59 or 8.61. If the new policy is created for Infrastructure CPU, Cloud Manager prompts you to apply the Infrastructure CPU, because this newly created policy will be applicable for the next Infrastructure CPU Download.
If the policy already exists, the Environment Name is added to the existing policy and a message is displayed about this addition.
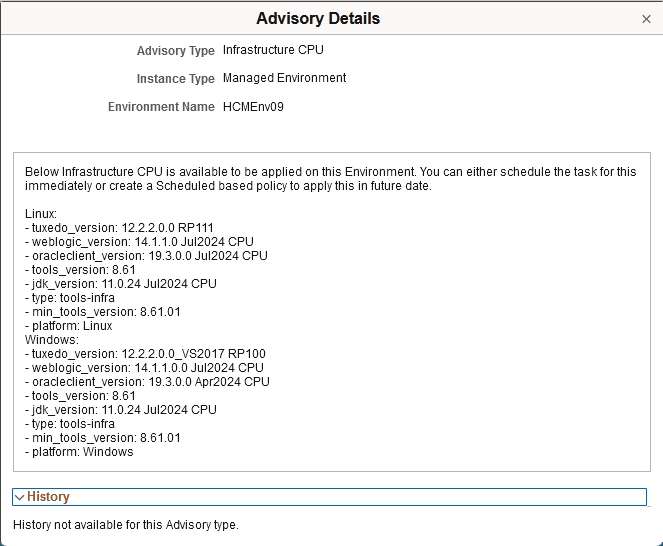
Click the Details icon for the advisory. The Advisory Details page includes a list of the software components, such as Java, Tuxedo, WebLogic, and Oracle Database client, to be applied with the Infrastructure CPU.
This example illustrates the Advisory Details page for Infrastructure CPU for the selected environment.
Using Server Level Advisories
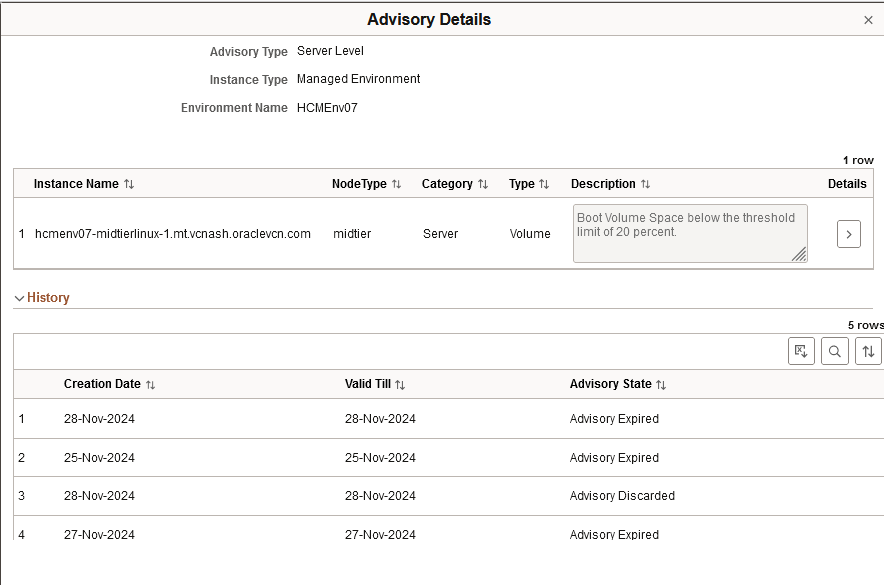
Server Level advisories notify you when the available boot volume threshold percentage drops below the threshold set on the Advisory Settings page. The environment owner can consider increasing the boot volume space in OCI. See Enabling Advisory Settings.
This example illustrates the Advisory Details page for Server Level for the selected environment.
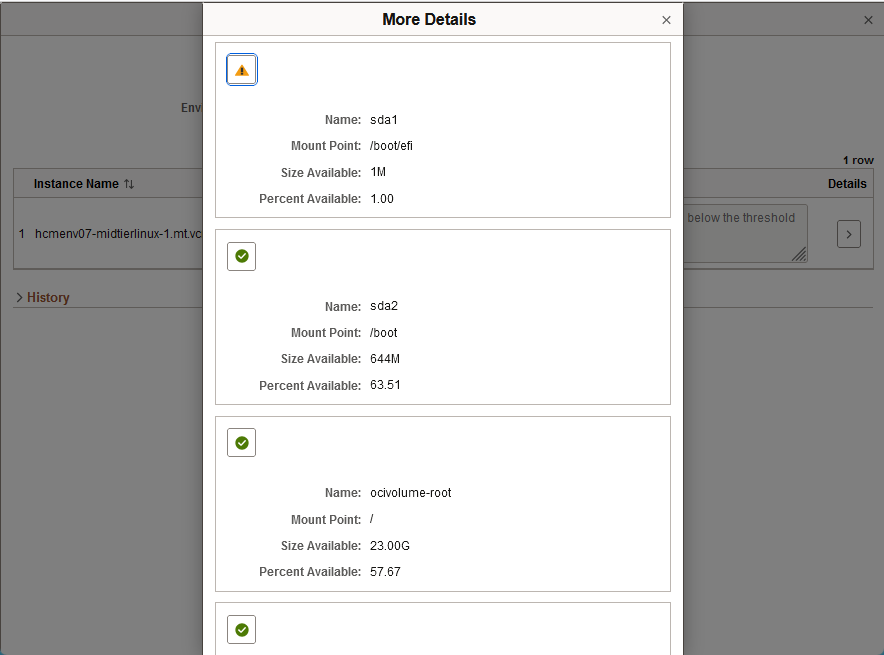
Click the Details icon in the grid at the top of the page. The modal window displays the percentage used for each partition of the boot volume. Use the information to pinpoint which one is over the threshold.
This example illustrates the More Details page for a Server Level Advisory.