4.5 補間
頂点またはエッジのサイズまたは色に補間を適用できます。次の補間タイプがサポートされています:
4.5.1 線形補間
デフォルトの線形補間を使用すれば、プロパティ値を使用して、ある範囲内のノードまたはエッジのサイズを定義して、指定した範囲を補間できます。
次の例を検討してください:
// This import is not necessary if you are using Oracle JET.
import '@ovis/graph/alta.css';
import Visualization from '@gvt/graphviz';

const vertices = [
  {
    id: 1,
    properties: {
      label: 'blue',
      name: 'Hello',
      age: 10
    }
  },
  {
    id: 2,
    properties: {
      label: 'blue',
      name: 'World',
      age: 20
    }
  },
  {
    id: 3,
    properties: {
      name: 'Some Name',
      age: 30
    }
  }
];

const edges = [
  {
    id: 1,
    source: 1,
    target: 2
  },
  {
    id: 2,
    source: 2,
    target: 3
  }
];

const settings = {
  showLegend: false,
  ruleBasedStyles: [{
    component: 'vertex',
    target: 'vertex',
    stylingEnabled: true,
    conditions: {
      operator: 'and',
      conditions: [{
        property: "label",
        operator: "=",
        value: "blue"
      }]
    },
    style: { color: 'blue' }
  }],
  baseStyles: {
    vertex: {
      // The label is changed to see the size of the node on it.
      label: { text: '${interpolate("properties.age", 1, 20)}' },
      // The size will be defined by the interpolation of properties.age in the range of 1 -> 20.
      size: '${interpolate("properties.age", 1, 20)}'
    }
  }
};

new GraphVisualization({
  target: document.body,
  props: { data: { vertices, edges }, settings}
});
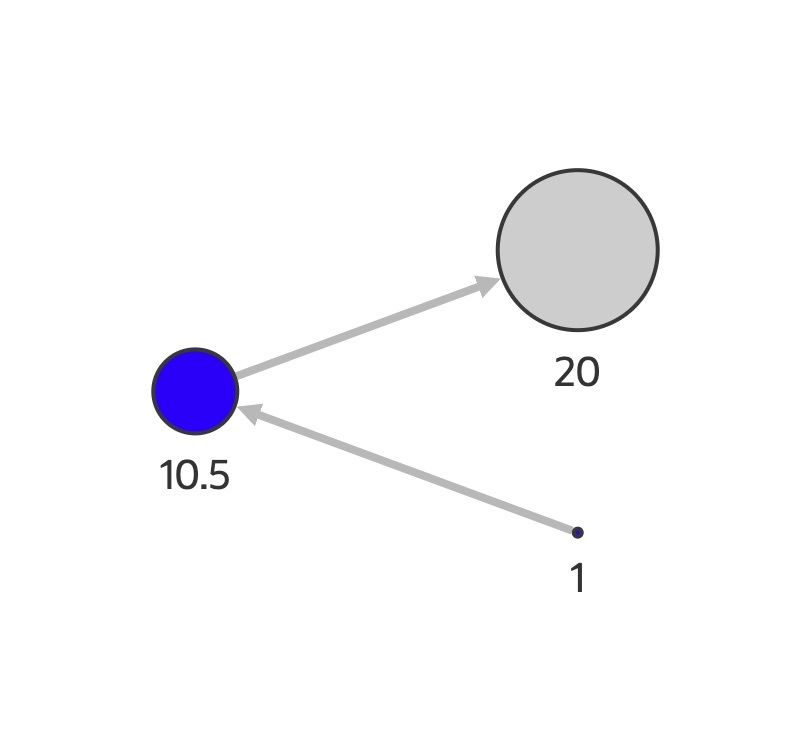
対応するビジュアライゼーションが次のように表示されます:
また、1つの範囲を使用するかわりに、複数の値を補間に使用することもできます。
// This import is not necessary if you are using Oracle JET.
import '@ovis/graph/alta.css';
import Visualization from '@gvt/graphviz';

const vertices = [
  {
    id: 1,
    properties: {
      label: 'blue',
      name: 'Hello',
      age: 10
    }
  },
  {
    id: 2,
    properties: {
      label: 'blue',
      name: 'World',
      age: 20
    }
  },
  {
    id: 3,
    properties: {
      name: 'Some Name',
      age: 30
    }
  }
];

const edges = [
  {
    id: 1,
    source: 1,
    target: 2
  },
  {
    id: 2,
    source: 2,
    target: 3
  }
];

const settings = {
  showLegend: false,
  ruleBasedStyles: [{
    component: 'vertex',
    target: 'vertex',
    stylingEnabled: true,
    conditions: {
      operator: 'and',
      conditions: [{
        property: "label",
        operator: "=",
        value: "blue"
      }]
    },
    style: { color: 'blue' }
  }],
  baseStyles: {
    vertex: {
      // The label is changed to see the size of the node on it.
      label: { text: '${interpolate("properties.age", 1, 20, 40)}' },
      // The size will be defined by the interpolation of properties.age using the values of 1, 20, 40.
      size: '${interpolate("properties.age", 1, 20, 40)}'
    }
  }
};

new GraphVisualization({
  target: document.body,
  props: { data: { vertices, edges }, settings}
});
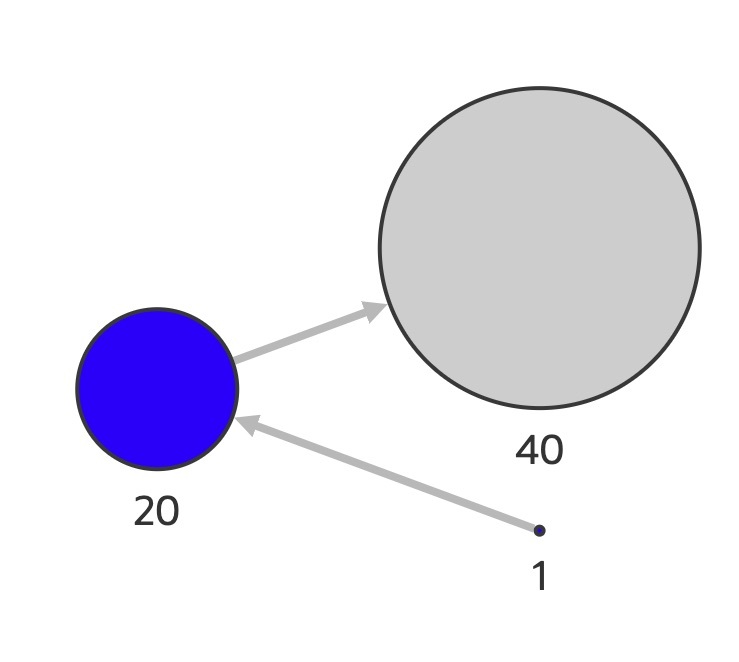
前述の設定のビジュアライゼーションは、次のように表示されます:
親トピック: 補間
4.5.2 離散補間
離散補間を使用すれば、指定した範囲を補間するための値としてプロパティ値を使用して、定義した範囲内の頂点またはエッジのサイズを定義できます。線形補間とは異なり、範囲の正確な開始値または終了値のみが結果の値となります。プロパティ値が最小値と最大値の間の前半部分にある場合は切り上げられます。それ以外の場合、切り捨てられます。
次の例を検討してください:
// This import is not necessary if you are using Oracle JET.
import '@ovis/graph/alta.css';
import Visualization from '@gvt/graphviz';

const vertices = [
  {
    id: 1,
    properties: {
      label: 'blue',
      name: 'Hello',
      age: 10
    }
  },
  {
    id: 2,
    properties: {
      label: 'blue',
      name: 'World',
      age: 20
    }
  },
  {
    id: 3,
    properties: {
      name: 'Some Name',
      age: 30
    }
  }
];

const edges = [
  {
    id: 1,
    source: 1,
    target: 2
  },
  {
    id: 2,
    source: 2,
    target: 3
  }
];

const settings = {
  showLegend: false,
  ruleBasedStyles: [{
    component: 'vertex',
    target: 'vertex',
    stylingEnabled: true,
    conditions: {
      operator: 'and',
      conditions: [{
        property: "label",
        operator: "=",
        value: "blue"
      }]
    },
    style: { color: 'blue' }
  }],
  baseStyles: {
    vertex: {
      // The label is changed to see the size of the node on it.
      label: { text: '${interpolate.discrete("properties.age", 1, 20)}' },
      // The size will be defined by the interpolation of properties.age in the range of 1 -> 20.
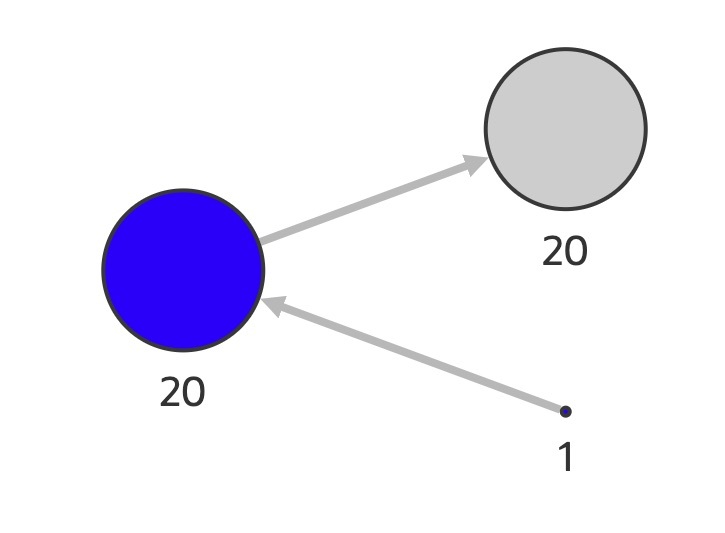
      // In this example since the node with age 20 is exactly in the middle, it will be rounded up to 20.
      size: '${interpolate.discrete("properties.age", 1, 20)}'
    }
  }
};

new GraphVisualization({
  target: document.body,
  props: { data: { vertices, edges }, settings}
});
対応するグラフ・ビジュアライゼーションを次に示します:
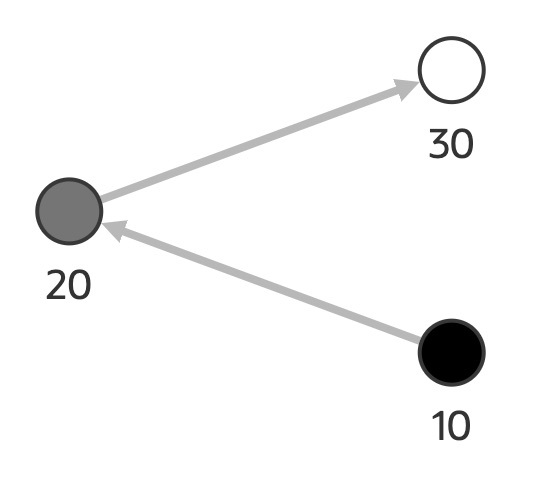
離散補間は、色を使用して適用することもできます。離散的に補間する色のみを定義する必要があります。
次の例を検討してください:
// This import is not necessary if you are using Oracle JET.
import '@ovis/graph/alta.css';
import Visualization from '@gvt/graphviz';

const vertices = [
  {
    id: 1,
    properties: {
      label: 'blue',
      name: 'Hello',
      age: 10
    }
  },
  {
    id: 2,
    properties: {
      label: 'blue',
      name: 'World',
      age: 20
    }
  },
  {
    id: 3,
    properties: {
      name: 'Some Name',
      age: 30
    }
  }
];

const edges = [
  {
    id: 1,
    source: 1,
    target: 2
  },
  {
    id: 2,
    source: 2,
    target: 3
  }
];

const settings = {
  baseStyles: {
    vertex: {
      label: { text: '${interpolate.discrete("properties.age", "black", "white")}' },
      color: '${interpolate.discrete("properties.age", "black", "white")}'
    }
  }
};

new GraphVisualization({
  target: document.body,
  props: { data: { vertices, edges }, settings }
});
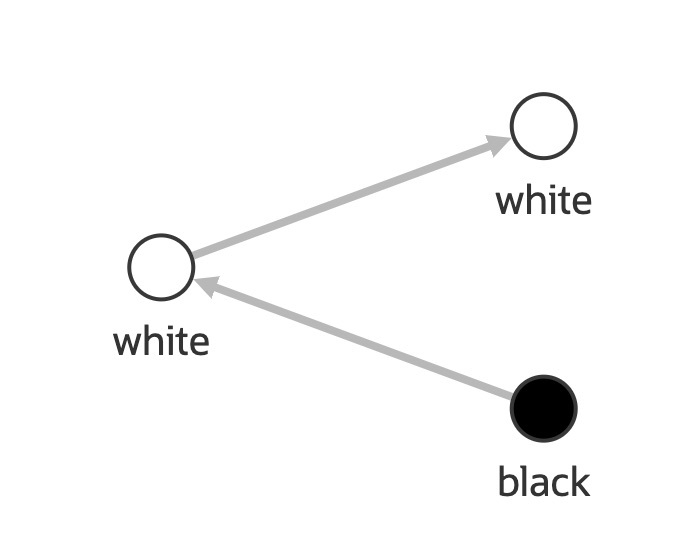
対応するビジュアライゼーションが次のように表示されます:
親トピック: 補間
4.5.3 色補間
interpolate.color関数を使用して、色を線形補間することもできます。目的のプロパティを補間するための色を定義する必要があります。
次の例を検討してください:
// This import is not necessary if you are using Oracle JET.
import '@ovis/graph/alta.css';
import Visualization from '@gvt/graphviz';

const vertices = [
  {
    id: 1,
    properties: {
      label: 'blue',
      name: 'Hello',
      age: 10
    }
  },
  {
    id: 2,
    properties: {
      label: 'blue',
      name: 'World',
      age: 20
    }
  },
  {
    id: 3,
    properties: {
      name: 'Some Name',
      age: 30
    }
  }
];

const edges = [
  {
    id: 1,
    source: 1,
    target: 2
  },
  {
    id: 2,
    source: 2,
    target: 3
  }
];

const settings = {
  baseStyles: {
    vertex: {
      label: { text: '${properties.age}' },
      color: '${interpolate.color("properties.age", "black", "white")}'
    }
  }
};

new GraphVisualization({
  target: document.body,
  props: { data: { vertices, edges }, settings }
});
対応するビジュアライゼーションが次のように表示されます:
親トピック: 補間
