4.1 Alarms and Events Overview
Alarms provide information pertaining to a system operational condition that a network manager may need to act upon. An alarm might represent a change in an external condition, for example, a communications link has changed from connected to disconnected state. Alarms can have the following severities:
- Critical application error
- Major application error
- Minor application error
- Cleared
An alarm is considered inactive once it has been cleared and cleared alarms are logged on the Alarms & Events and theView History page.
Note:
Some events may be throttled because the frequently generated events can overload the MP or OAM server's system or event history log (for example, generating an event for every ingress message failure). By specifying a throttle interval (in seconds), the events display no more than once during the interval duration period (for example, if the throttle interval is 5 seconds, the event is logged no more than once every 5 seconds).Figure 4-1 shows how Alarms and Events are organized in the application.
Figure 4-1 Flow of Alarms
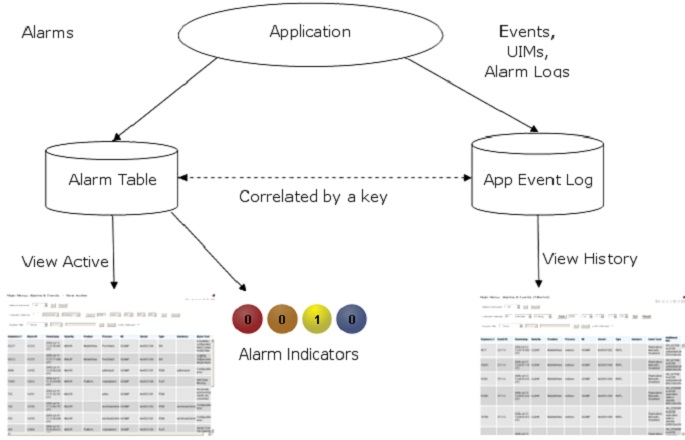
Alarms and events are recorded in a database log table. Application event logging provides an efficient way to record event instance information in a manageable form, and is used to:
- Record events representing alarmed conditions
- Record events for later browsing
- Implement an event interface for generating SNMP traps
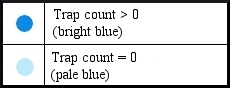
Alarm indicators, located in the User Interface banner, indicate all critical, major, and minor active alarms. A number and an alarm indicator combined represent the number of active alarms at a specific level of severity. For example, if you see the number six in the orange-colored alarm indicator, it means that there are six major active alarms. This is shown in Figure 4-2 and Figure 4-3.
Figure 4-2 Alarm Indicators Legend
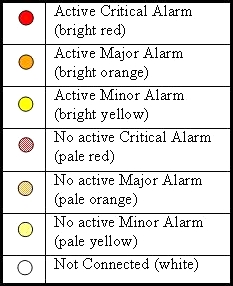
Figure 4-3 Trap Count Indicator Legend
Note:
DSR uses the OATMeal (OAM Alarm Task) for alarms whose customer visible state is determined at the OAM level using merged MP status data. For these alarms, the DA-MP, or SBR process detects the condition and records the applicable status or alarm id in the corresponding merged status table. The DSR OAM OATMeal task then evaluates the merged data and raises or clears the alarm displayed in the GUI.This approach is used for managed object and distributed state alarms. Before an alarm is displayed to the user, DSR OAM validates the current configuration, administrative state, active MP status, DA-MP leader state, alarm ownership, aggregation thresholds, alarm-group thresholds, and clear conditions, as applicable. The default DsroamPollingInterval is 10 seconds, so OATMeal managed alarms are normally raised or cleared after OAM processes the next polling cycle.
This design reduces alarm volume in large DSR deployments and ensures that GUI alarms represent the current OAM validated state of the managed object rather than a raw local condition from one MP.
Table 4-1 OATMeal Alarms
| OATMeal Alarm Category | Alarm Ids |
|---|---|
| Fixed Connections | 22101, 22102, 22103, 22104 |
| IPFE Connections | 22101, 22102, 22103, 22104 |
| Peer Nodes | 22051, 22052 |
| Route Lists | 22053, 22054, 22055 |
| Egress Throttle Groups | 22057, 22058 |
| Traffic Throttle Points | 22072, 22074 |
| Firewall | 25607, 25608 |
| Capacity | 22710, 22728 |