Using Metrics
This section describes how to view metrics associated with an event.
|
Page Name |
Definition Name |
Usage |
|---|---|---|
|
RAE_EVENT_METRICS |
View metrics associated with an event. |
Use the Event - Metrics page (RAE_EVENT_METRICS) to view metrics associated with an event.
Navigation
Select an event from the list, or create a new event.
Click the Metrics tab on the Event page.
Image: Event - Metrics page
This example illustrates the fields and controls on the Event - Metrics page.
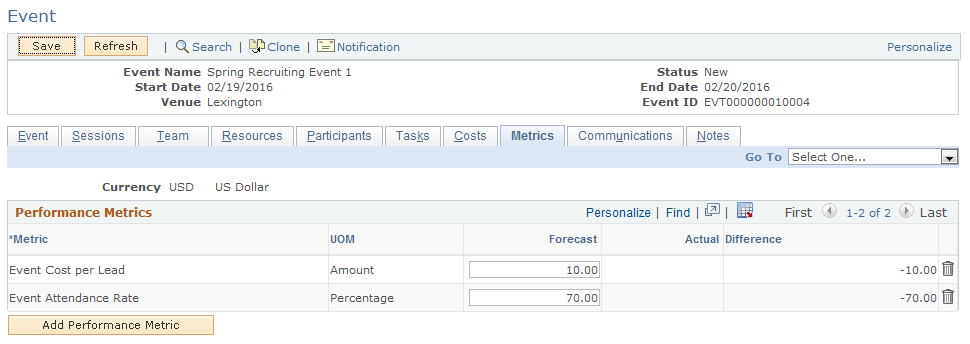
During the event planning process, marketing managers and marketers set budgets, track costs and forecast the results that are expected of the event. During the last stage of event management, event analysis, marketers can assess event impact, whether or not it was successful and if it met forecasted expectations. The event metrics page is where event analysis can be performed, providing marketers answers to questions like:
Was the event outcome (revenue, leads and opportunities generated) worth the cost?
Did the event generate the leads and opportunities expected?
How effective was the event promotion and invitation? (response rate)
Was the event compelling to the target audience? (response rate)
Were we able to get registrants to show up for the event? Were event reminders effective? Could event logistics have been altered to increase attendance?
What was the event return on investment?
|
Field or Control |
Definition |
|---|---|
| Metrics |
Select a metric from the list of choices. Metrics are calculated when the page is opened, so current values are displayed. Note: You can define your own metrics using the Metrics - Detail page in PeopleSoft Marketing. Refer to the Marketing documentation for more information. |
| UOM (Unit of Measurement) |
Determined based upon the metric selected. |
| Forecast Value |
This value is entered manually. When the metric is calculated, the system subtracts the actual value from the forecasted value, resulting in the difference value. |
| Actual Value |
The computed value from the metric. |
| Difference |
The Actual Value minus the Forecast Value. |
| Currency |
The Currency Code, as entered on the Events page. |
Supported metrics for events include:
Cost: Total cost of the event.
Cost per Lead: Total cost of the event divided by the number of leads generated from it.
Cost per Opportunity: Total cost of the event divided by the number of opportunities generated from it. The number of opportunities is determined by counting all leads generated from the event.
Number of Leads: The total number of leads generated from the event.
Number of Opportunities: The total number of opportunities associated with the event.
Response Rate: The number of registered and waitlisted attendees divided by the number invited, multiplied by 100. Registered and waitlisted invitees are included in this calculation only if their Invited check boxes were selected.
Attendance Rate: The number of attendees divided by the Capacity, multiplied by 100.
Percent Requested Not Invited: Those who were not invited who registered directly through the website versus those who were invited and registered.
No show rate: The number attended divided by the number who registered.
Revenue: The total revenue received (if applicable, for example, for fundraising events).
Profit: Revenue minus Cost.
Cost per Person vs. Revenue.