Monitoring Real-Time Information
These topics discuss how to monitor real-time information.
Important! It is recommended that you run Supervisor Desktop on Internet Explorer version 7 or later.
The Supervisor Desktop component is accessible to users who have the SD_TEAMLEADER, SD_SUPERVISOR, or SD_ADMINISTRATOR role. The available functionality varies based on the role that is assigned to them.
|
Page Name |
Definition Name |
Usage |
|---|---|---|
|
RB_SD_MONITOR |
Monitor real-time information. |
|
|
RB_SD_MONITOR |
View agent details. |
|
|
RB_SD_MONITOR |
View queue details. |
Use the Realtime Monitoring page (RB_SD_MONITOR) to monitor real-time information.
Navigation
Image: Realtime Monitoring page showing agent statistics by assigned queues
This example illustrates the fields and controls on the Realtime Monitoring page showing agent statistics by assigned queues. You can find definitions for the fields and controls later on this page.
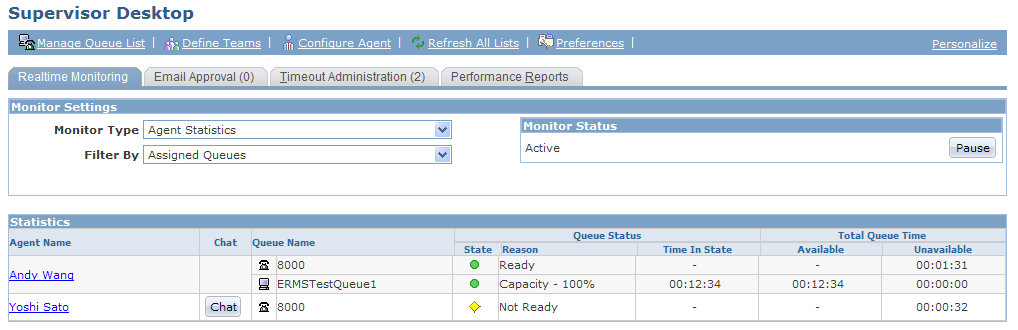
Image: Realtime Monitoring page showing agent statistics by team
This example illustrates the fields and controls on the Realtime Monitoring page showing agent statistics by team. You can find definitions for the fields and controls later on this page.
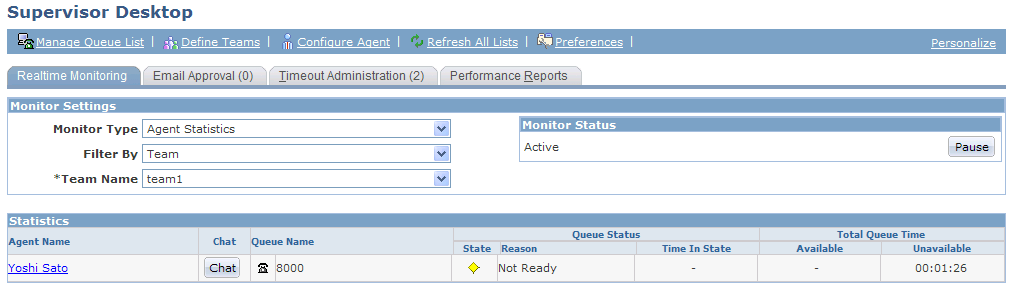
Image: Realtime Monitoring page showing agent statistics by queue list
This example illustrates the fields and controls on the Realtime Monitoring page showing agent statistics by queue list. You can find definitions for the fields and controls later on this page.
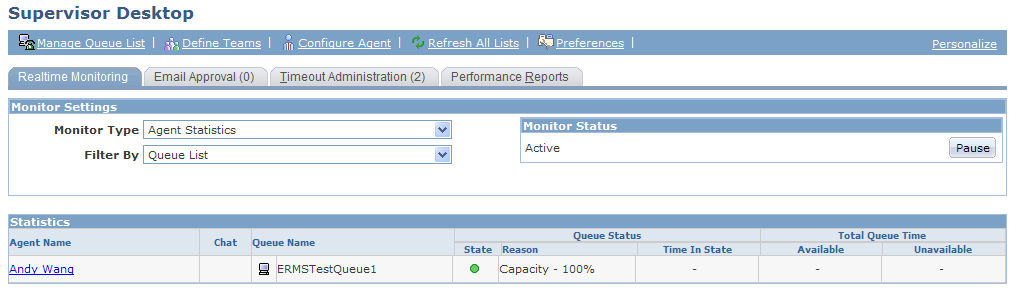
Image: Realtime Monitoring page showing queue statistics by assigned queues
This example illustrates the fields and controls on the Realtime Monitoring page showing queue statistics by assigned queues. You can find definitions for the fields and controls later on this page.
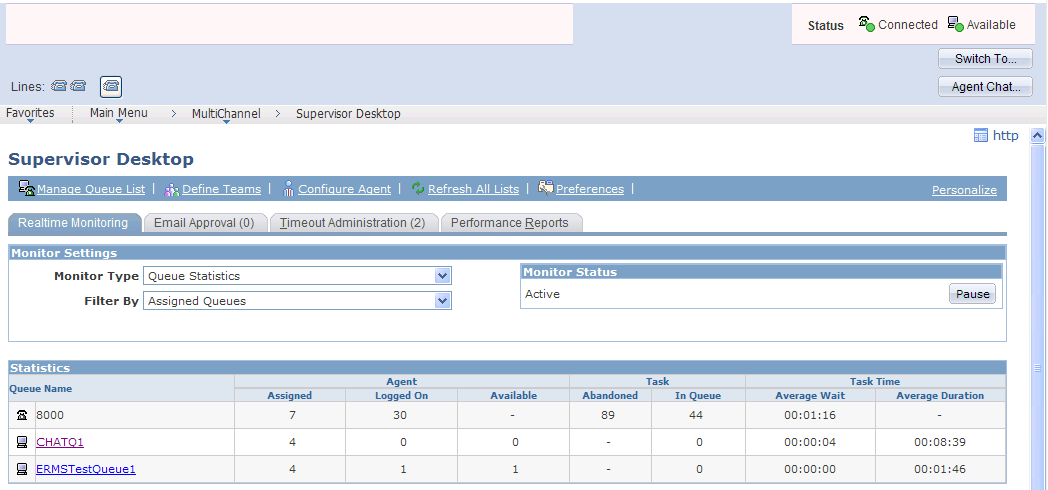
Image: Realtime Monitoring page showing queue statistics by team
This example illustrates the fields and controls on the Realtime Monitoring page showing queue statistics by team. You can find definitions for the fields and controls later on this page.
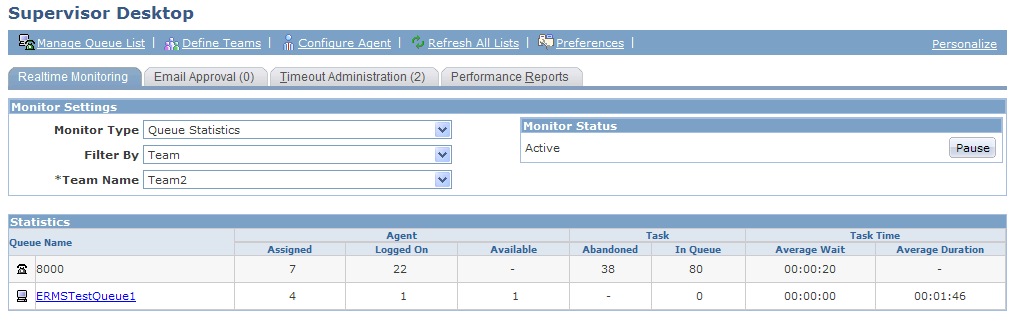
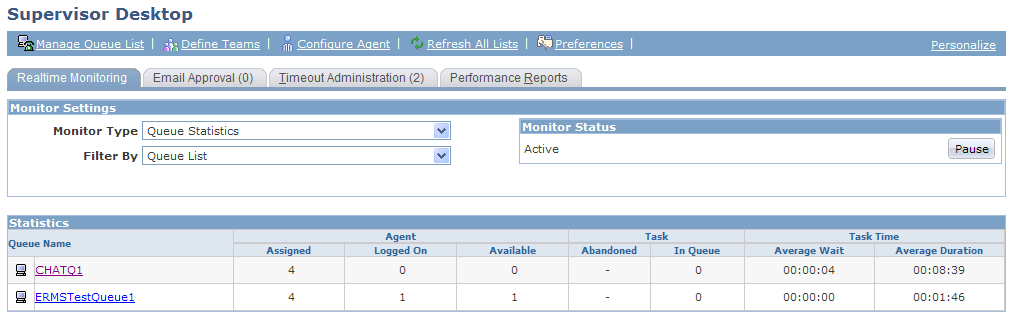
Image: Realtime Monitoring page showing queue statistics by queue list
This example illustrates the fields and controls on the Realtime Monitoring page showing queue statistics by queue list. You can find definitions for the fields and controls later on this page.
Users can select the different types of data as well as the collection of data to be monitored by switching values in the Monitor Type and Filter By fields respectively:
Agent statistics by:
Assigned queues.
Queues that are specified in the queue list.
Defined teams.
Queue statistics by:
Assigned queues.
Queues that are specified in the queue list.
Defined teams.
Note: Queue lists or teams must be defined before they are available as options under filter statistics.
Monitor Status
When the monitor status is active, real-time statistics are constantly updated. Click the Pause button to freeze the display. Click the Resume button to the restart real-time update.
A text message appears in this section if Supervisor Desktop is unable to perform real-time monitoring.
Statistics
The information that appears in this grid changes slightly based on the selected monitor type: agent or queue statistics.
The following real-time data and functionality are available when users view agent statistics:
The list of agents, who are logged into a queue, that resulted from the selected filter.
Click the agent link to view additional real-time information of the corresponding agent.
The ability to chat with agents if applicable (only available if the agent is logged into a multichannel queue).
The queue to which each agent is connected (separate displays for voice versus multichannel queues).
The queue status, the duration in which the agent remains in this status, and its current unused capacity (duration in status and capacity are only applicable to multichannel queues).
The total time in which the agent has been available (multichannel only) or unavailable since logging into the current queue.
The following real-time data is available when users view queue statistics:
The list of queues that resulted from the selected filter.
Click the queue link to view additional real-time information of the corresponding queue.
Numbers of agents that are configured for each queue, currently signed in, and are available to accept tasks (available agents only applicable for multichannel queues).
Numbers of tasks that have been abandoned by the queue (voice channel only) and are currently queued.
Important! Data for abandoned tasks is only supported for the voice channel only (that is, CTI queues), in which case a numerical value is displayed. For other queues, this piece of information is not supported by the REN server and therefore, the field shows a “-” symbol, indicating unavailability.
The average wait time to accept tasks and the average duration to finish tasks. The average duration is available to multichannel queues only.
Use the Realtime Monitoring - Details for <agent name> page (RB_SD_MONITOR) to view agent details.
Navigation
Click an agent link on the Realtime Monitoring page while the Monitor Type is set to Agent Statistics.
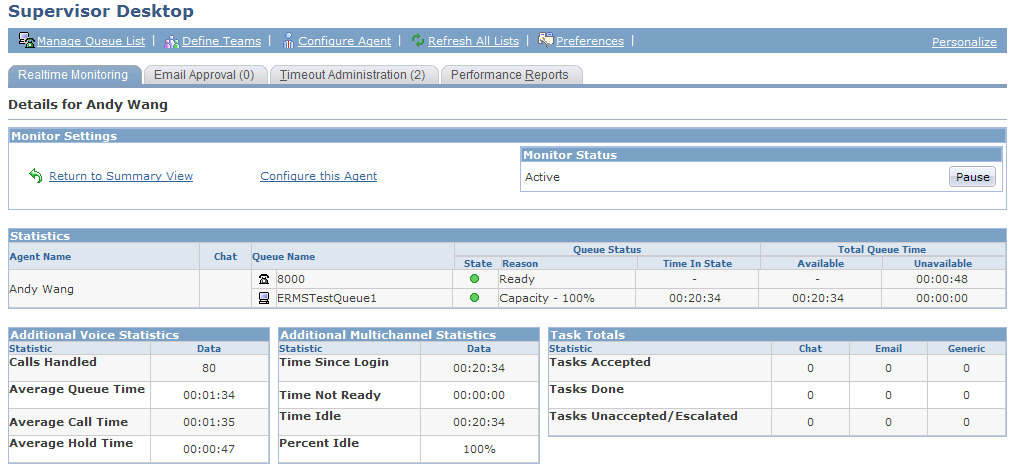
Image: Realtime Monitoring - Details for <agent name> page
This example illustrates the fields and controls on the Realtime Monitoring - Details for <agent name> page. You can find definitions for the fields and controls later on this page.
Monitor Settings
|
Field or Control |
Definition |
|---|---|
| Return to Summary View |
Click to return to the previous page where summary agent statistics are displayed. |
| Configure this Agent |
Click to access the Configure Agent component on a new browser window to add or edit the configuration of the selected agent. |
Additional Multichannel Statistics
This grid appears if the selected agent is a configured multichannel agent.
|
Field or Control |
Definition |
|---|---|
| Time Since Login |
Displays the time duration since the agent signed into a multichannel queue. |
| Time Not Ready |
Displays the duration during which the agent is in a not-ready mode since sign-in. This state is different from being in an unavailable state. This value is updated when the agent's maximum workload is reached (that is, capacity drops to 0 percent) and the server can no longer assign new tasks to this agent. |
| Time Idle |
Displays the duration during which the agent remains idle since sign-in. |
| Percent Idle |
Displays the agent's idle time in percentage. |
Additional Voice Statistics
This grid appears if the selected agent is a configured voice agent.
|
Field or Control |
Definition |
|---|---|
| Number Calls Handled |
Displays the number of calls that are handled by the agent since sign-in. |
| Average Queue Time |
Displays the average time that calls remain in queue taken by the agent. |
| Average Call Time |
Displays the average time to complete calls by the agent. |
| Average Hold Time |
Displays the average time that calls are put on hold by the agent. |
Task Totals (Multichannel only)
|
Field or Control |
Definition |
|---|---|
| Tasks Accepted |
Displays the number of tasks of each task type that are accepted by the agent. |
| Tasks Done |
Displays the number of tasks of each task type that are completed by the agent. |
| Tasks Unaccepted/Escalated |
Displays the number of tasks of each task type that are unassigned by the system, either because the agent did not accept them when the system notified the agent through the Multichannel Toolbar or the tasks have been escalated. |
Use the Realtime Monitoring - Details for <queue name> page (RB_SD_MONITOR) to view queue details.
Navigation
Click a queue link on the Realtime Monitoring page while the Monitor Type is set to Queue Statistics.
Note: Details for a voice queue are not available. For this reason, voice queues are not shown as links in the queue summary display.
Image: Realtime Monitoring - Details for <queue name> page (1 of 2)
This example illustrates the fields and controls on the Realtime Monitoring - Details for <queue name> page (1 of 2). You can find definitions for the fields and controls later on this page.
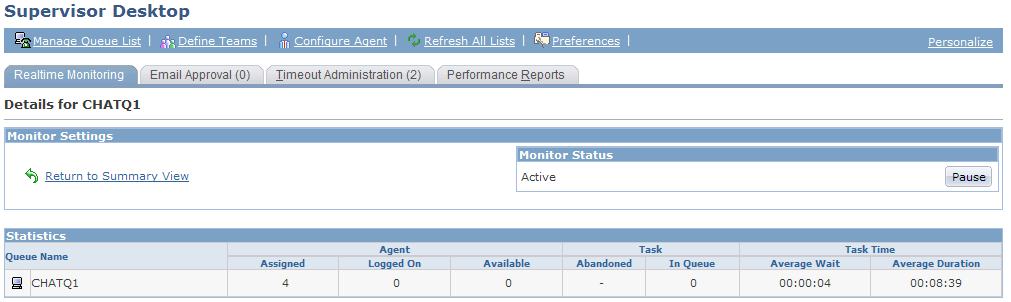
Image: Realtime Monitoring - Details for <queue name> page (2 of 2)
This example illustrates the fields and controls on the Realtime Monitoring - Details for <queue name> page (2 of 2). You can find definitions for the fields and controls later on this page.
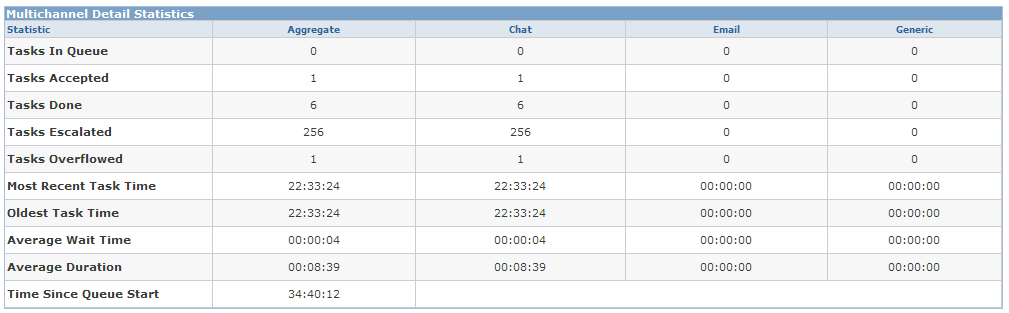
Multichannel Detail Statistics
|
Field or Control |
Definition |
|---|---|
| Tasks In Queue |
Displays the number of tasks (by task type) that are currently queued. |
| Tasks Accepted |
Displays the number of tasks of each task type that have been accepted since the queue or server starts. This value is incremental only. |
| Tasks Done |
Displays the number of tasks of each task type that are completed. This value is incremental only. |
| Tasks Escalated |
Displays the number of tasks of each task type that have been removed from the queue or the agent's task list and categorized as the escalated timeout type. This value is incremental only. |
| Tasks Overflowed |
Displays the number of tasks of each task type that are removed from the queue and categorized as the overflow timeout type. This value is incremental only. |
| Most Recent Task Time |
Displays the elapsed time of the most recent task in the queue. |
| Oldest Task Time |
Displays the elapsed time of the oldest task. |
| Average Wait Time |
Displays the average wait time for tasks to be accepted in the queue. |
| Average Duration |
Displays the average time that is used to complete tasks in the queue. |
| Time Since Queue Start |
Displays the elapsed time since the server (or a specific queue) starts. |