Adding and Adjusting Forecasts
This topic discusses how to:
Add and adjust sales forecasts.
Calculate forecast subtotals.
Generate forecast charts.
|
Page Name |
Definition Name |
Usage |
|---|---|---|
|
RSF_FCAST_ENTER |
Adjust a sales forecast that is based on an individual sales representative's revenue allocations for working opportunities. |
|
|
RSF_FCAST_SUMMARY |
Calculate and view the subtotals of a revenue forecast. |
|
|
RSF_FCAST_CHART |
Generate a chart of the revenue forecast. |
Use the Forecast - Forecast page (RSF_FCAST_ENTER) to adjust a sales forecast that is based on an individual sales representative's revenue allocations for working opportunities.
Navigation
Image: Forecast - Forecast page
This example illustrates the fields and controls on the Forecast - Forecast page.
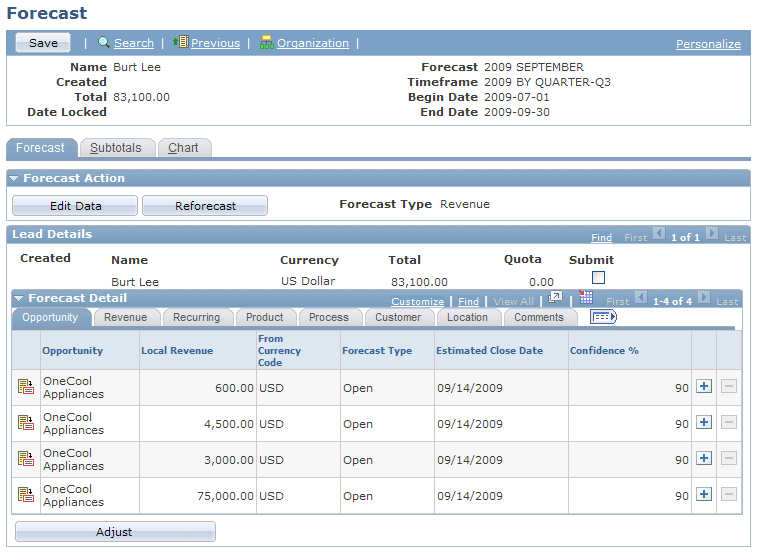
This page displays the selected sales users' opportunities that have forecasted dates within the specified time frame and a status of either Open or Closed - Won. Forecasts do not include opportunities with the status Closed - Lost or Inactive.
You can view forecast data on each of the tabs on this page.
|
Field or Control |
Definition |
|---|---|
| Edit Data and Display Only |
Click the Edit Data button to access edit mode and then enter and modify data. After you access edit mode, the system renames the button Display Only. You can return to display-only mode by clicking this button. The Edit Data button is enabled only if your access profile permits you to edit forecasts. |
| Reforecast |
Click to regenerate the forecast. This action eliminates all modifications and adjustments, and reruns the forecast based on current opportunity data. You cannot reforecast or make changes to a forecast once it is submitted. |
| Submit and Submit All |
Select to submit the forecast when you save the page. Submitting a forecast makes it available to managers. Managers can view all forecasts, submitted or not, if the sales access profile is set to permit viewing unsubmitted forecasts. You cannot make changes to a forecast once it is submitted. Note: The Submit All check box appears only if your user profile permits you to submit multiple forecasts. |
| Local Revenue |
Enter the amount of revenue that is anticipated from the sale. |
| From Currency Code |
Enter the sales user's currency code. |
| Forecast Type |
Select a user-defined forecast type. See Forecast Type Page. |
| Estimated Close Date |
Enter the forecast estimated date that the sale will occur. |
| Confidence % (confidence percentage) |
Enter a whole number that specifies the probability that the forecast will become an actual sale. |
| Adjust |
Click to add a row and make adjustments to the sales user's forecast data. Adjustments affect the totals and are directly associated with the sales representative who makes the adjustment. |
Use the Forecast - Subtotals page (RSF_FCAST_SUMMARY) to calculate and view the subtotals of a revenue forecast.
Navigation
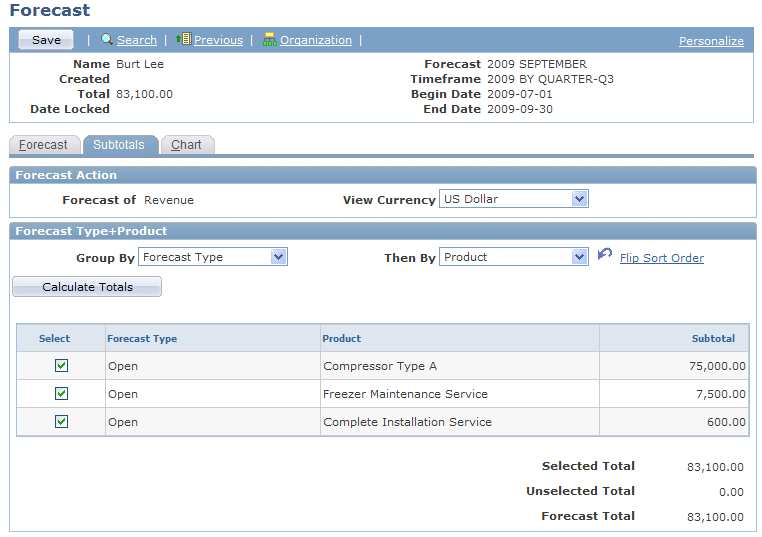
Image: Forecast - Subtotals page
This example illustrates the fields and controls on the Forecast - Subtotals page.
|
Field or Control |
Definition |
|---|---|
| View Currency |
Select the currency in which to express the forecast amounts. The default is the sales user's default currency. |
| Group By and Then By |
You can use subtotals to generate and view a forecast's subsets. For example, suppose that the overall forecast is for November 2004 and you want to know the confidence levels that make up the forecast and you want to know those levels by region. In that case, you would select Confidence % in the Group By field and Region in the Then By field. Note: You must enter a value in the Group By field to use subtotals. |
| Select |
Select the check box next to each item that you want to group into a separate subtotal. The sum for the selected items appears as the selected total, and the sum of items that are not selected is the unselected total. For example, if 10 rows appear and you select this check box for the first, third, and fifth rows, then the selected total is the sum of the first, third, and fifth rows. The unselected total is the sum of the seven rows that you did not select. |
Use the Forecast - Chart page (RSF_FCAST_CHART) to generate a chart of the revenue forecast.
Navigation
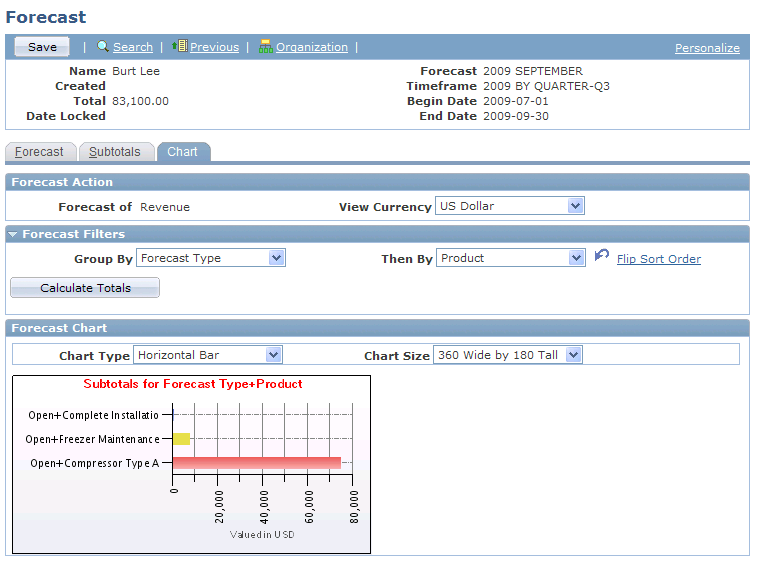
Image: Forecast - Chart page
This example illustrates the fields and controls on the Forecast - Chart page.
|
Field or Control |
Definition |
|---|---|
| View Currency |
If you specified the currency on the Subtotals page, the system carries it over to here. If you did not, specify it here. |
| Group By and Then By |
If you specified subtotals on the Subtotals page, the system carries them over to here. If you did not, specify them here. Note: You must have a value in the Group By field to generate a chart. |
| Chart Type |
Specify the type of chart to generate. Values include Bar Chart, Horizontal Bar Chart, Horizontal Stacked Bar Chart, and Stacked Bar Chart. |
| Chart Size |
Specify the size of the chart. |