19.2 Health Overview
The Health Overview provides a comprehensive overview of OMS and Repository operation and performance, and therefore allows you to view the overall health of your Enteprise Manager environment.
Accessing the Health Overview
From the Setup menu, select Manage Cloud Control and then Health Overview.
All major areas of Enterprise Manager are represented.
-
Overview: Provides key information for active Management Services such as the Management Agents, the WebLogic Administration Server, total number of monitored targets, number of administrators, and server load balancer (SLB) upload and console URLs, provided SLB is configured. If configured, the SLB upload and console URLs are also displayed.
-
Repository Details: Provides physical information about the Management Repository and the host on which the database is located. You can drill down into the database home page for more information and carry out administrative operations.
-
Job System Status: Displays key operational parameters of the Enterprise Manager Job service. For detailed information, you can click on the status icon to drill down into the Enterprise Manager Job Service home page.
-
Console Activity: Displays the overall load on the Enterprise Manager console through the average number of requests per minute and the average time required to process those requests.
-
Alerts: Provides details on the metric errors recorded and when an alert was triggered. In-context links to Incident Manager are also provided.
-
Performance Charts: Upload Backlog and Upload Rate, Backoff Requests, Notification backlog. You can drill down into any chart to view detailed metric information.
From this page, you can carry out all monitoring and management operations using the OMS and Repository menu.
Note:
The Diagnostic Metrics page is intended for use by Oracle Support when diagnosing issues with the OMS. The page can be accessed by selecting Monitoring and then Diagnostic Metrics from the OMS and Repository menu.
19.2.1 Viewing Enterprise Manager Topology and Charts
The Enterprise Manager Topology page provides a graphical representation of the Enterprise Manager infrastructure components and their association. Each node in the hierarchy displays key information about the member type, the host on which it resides, and the number of incidents, if any. The incident icons on each of the nodes expand to display a global view of current status for each node in the hierarchy.
Note:
In order for the Enterprise Manager repository database to appear in the Topology page, you must first manually discover the database. Manual discovery is also required in order to have the database's metric data (Database Time (centiseconds per second)) displayed in the charts.
Accessing the Enterprise Manager Topology
-
From the Setup menu, select Manage Cloud Control and then Health Overview.
-
Click on the OMS and Repository menu to display available operations that can be performed from this page.
-
Select Members and then Topology.
Enterprise Manager Charts
The Enterprise Manager Charts page displays eight charts representing key areas that together indicate the overall health of Enterprise Manager. These are Overall Files Pending Load -Agent, Job Step Backlog, Job Step Throughput (per second), Request Processing Time (ms), Database Time (centiseconds per second), CPU Utilization (%), Pages Paged-in (per second), Pages Paged-out (per second). Data can be viewed for the Last 24 hours, last 7 days or last 31 days.
Accessing the Enterprise Manager Charts
- From the Setup menu, select Manage Cloud Control and then Health Overview.
- Click on the OMS and Repository menu to display available operations that can be performed from this page.
- Select Monitoring and then Charts.
19.2.2 Determining Enterprise Manager Page Performance
Page Performance Monitoring and diagnosis feature provides you with the ability to identify and diagnose performance issues with Enterprise Manager pages without having to contact Oracle support.
Note:
The Enterprise Manager page performance tracing feature requires Agent version 12.1.0.4 or later.
The charts and tables in this page will display data only if the Agent that is monitoring Management Services and Repository target is version 12.1.0.4 or later. If you have upgraded Enterprise Manager 12.1.0.4, you should also upgrade the Agents on Management Service (OMS) machines to 12.1.0.4 in order to access the latest monitoring capabilities for the Management Services and Repository, as well as related targets.
See the Oracle® Enterprise Manager Cloud Control Upgrade Guide for more information on upgrading Agents.
To access Page Performance Monitoring and Diagnosis functionality:
- From the Setup menu, select Manage Cloud Control, and then Health Overview or Repository.
- From the OMS and Repository menu, select Monitoring and then Page Performance. The Page Performance page displays.
Overview
The overview tab provides details of the overall page performance in Enterprise Manager.
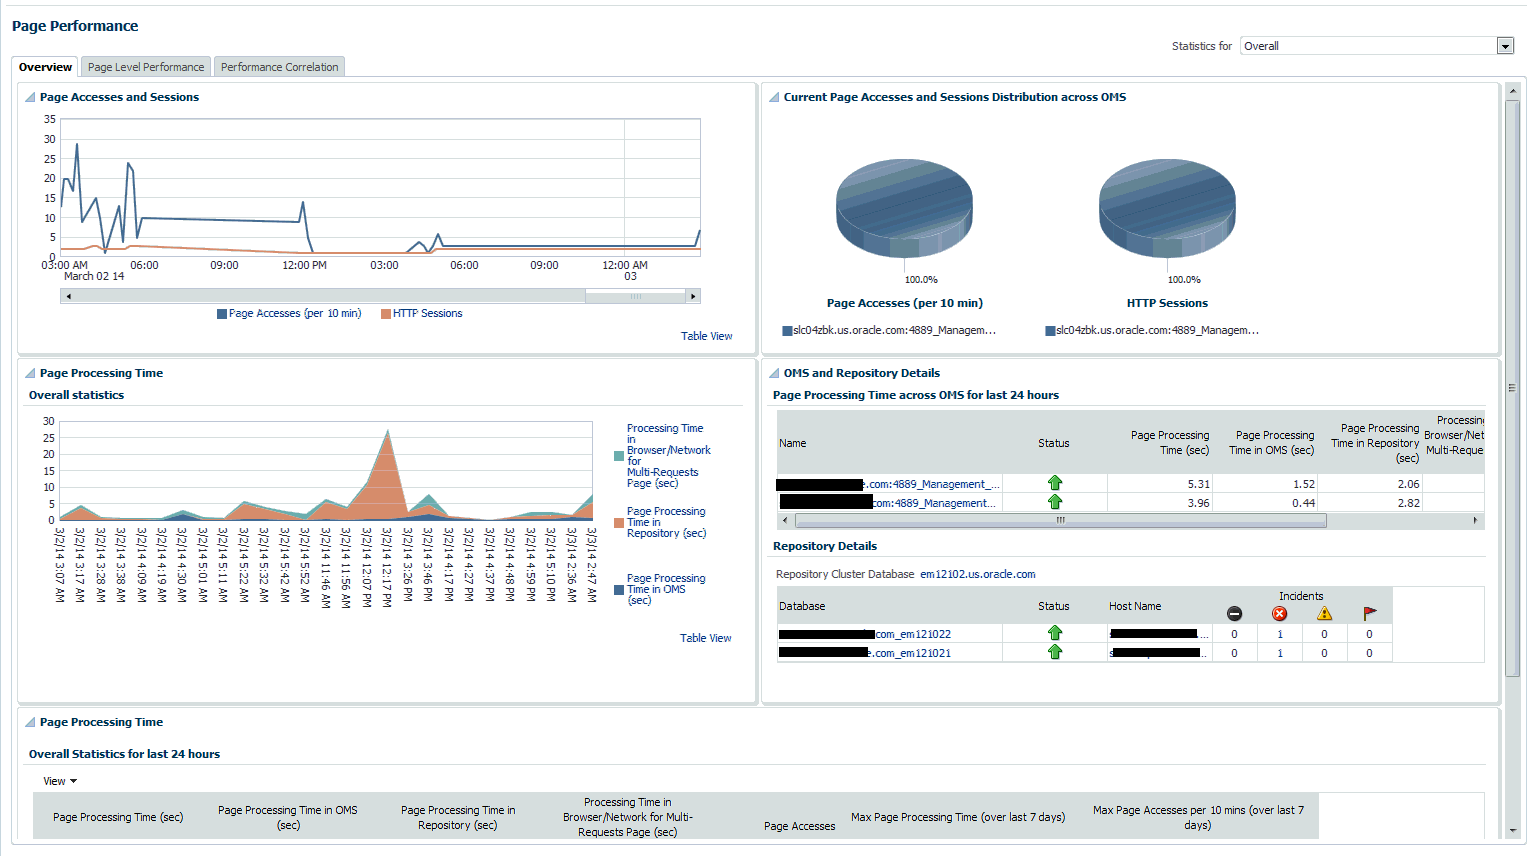
The charts display the Page Accesses and Sessions, Current Page Accesses and Sessions Distribution across OMSs and the Overall Statistics of page performance in the last 24 hours. There are details of the page performance in each of the OMSs as well as the details of the available repositories.
The Overall Statistics table provides the breakdown of times spent in the Repository, the OMS and network and the number of page accesses, the maximum time taken by page in the last 24 hours.
Page Level Performance
The page level performance tab shows the list of pages accessed in the last 24 hours.
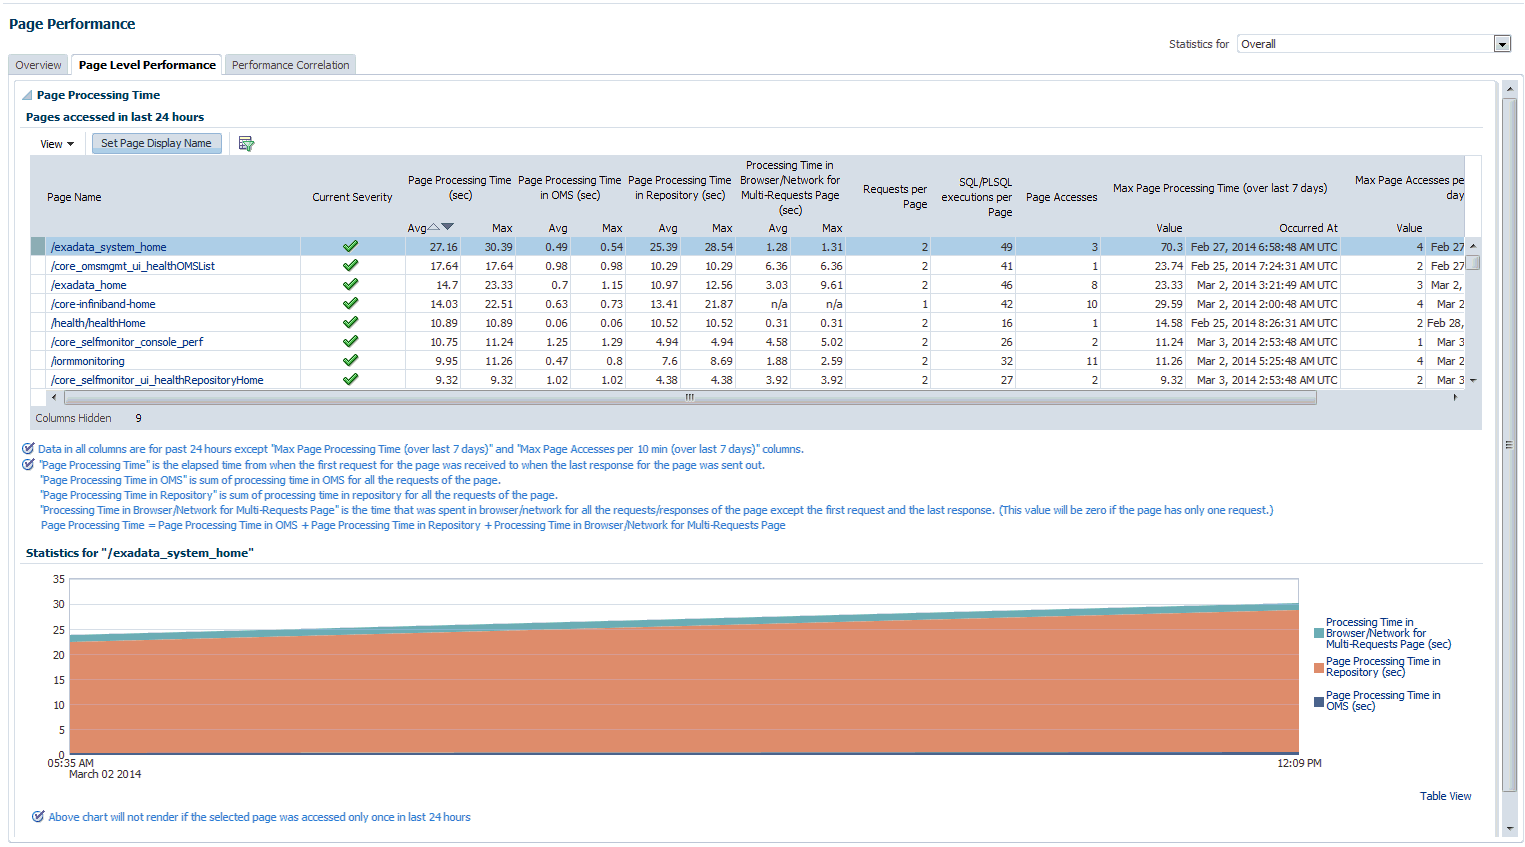
The page also displays the breakdown of time spent in the Repository and the OMS and network in a line graph format for each page.
Performance Correlation
The performance correlation tab displays graphs for page performance that allow you to correlate performance trends.
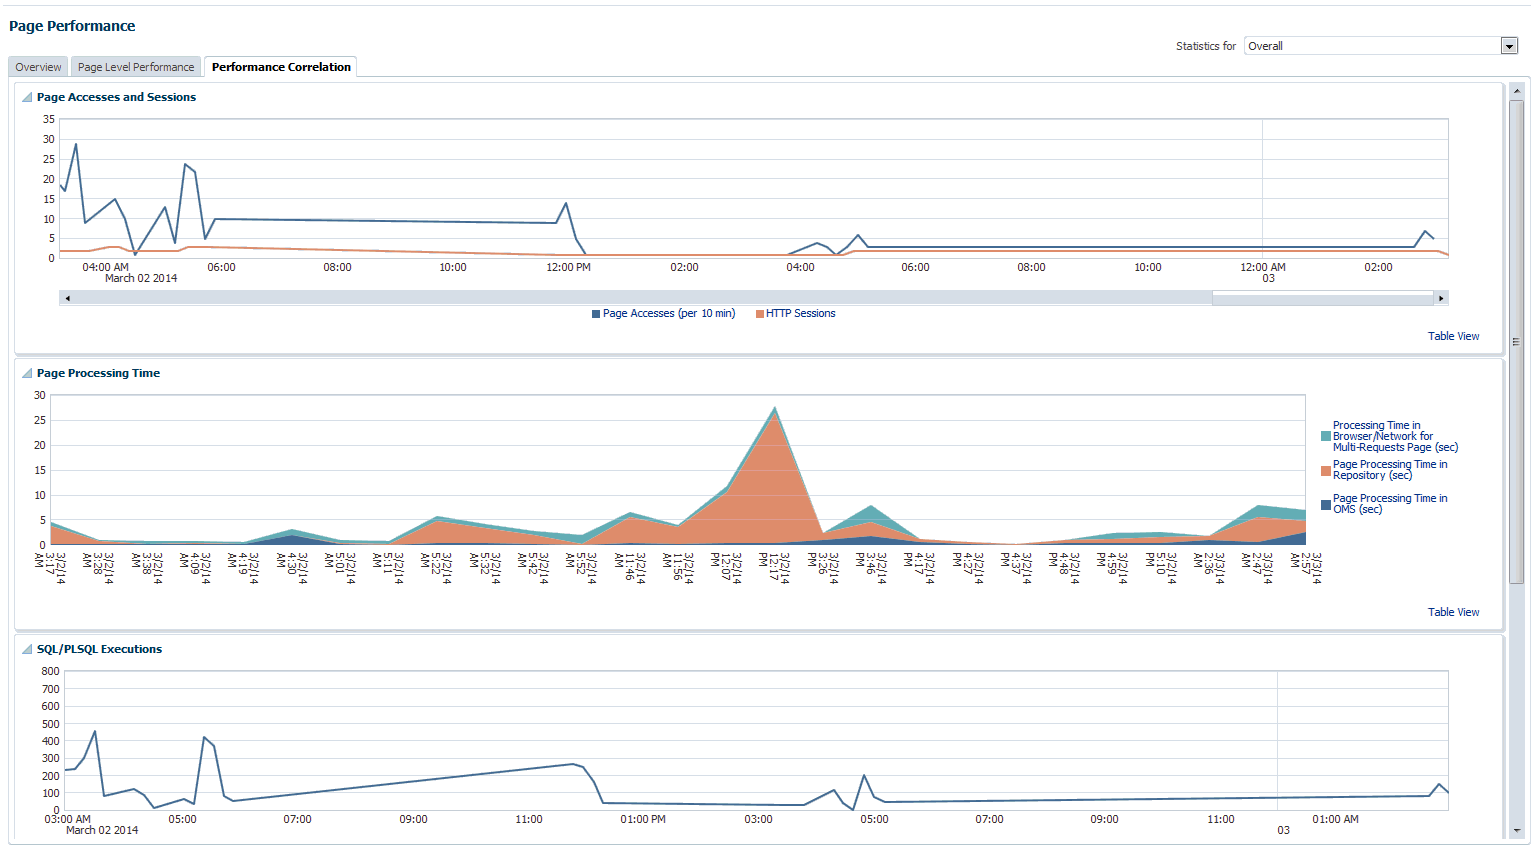
This tab provides details of page accesses and sessions, page processing time, SQL/PLSQL executions, and average active sessions.
Symptom Diagnosis
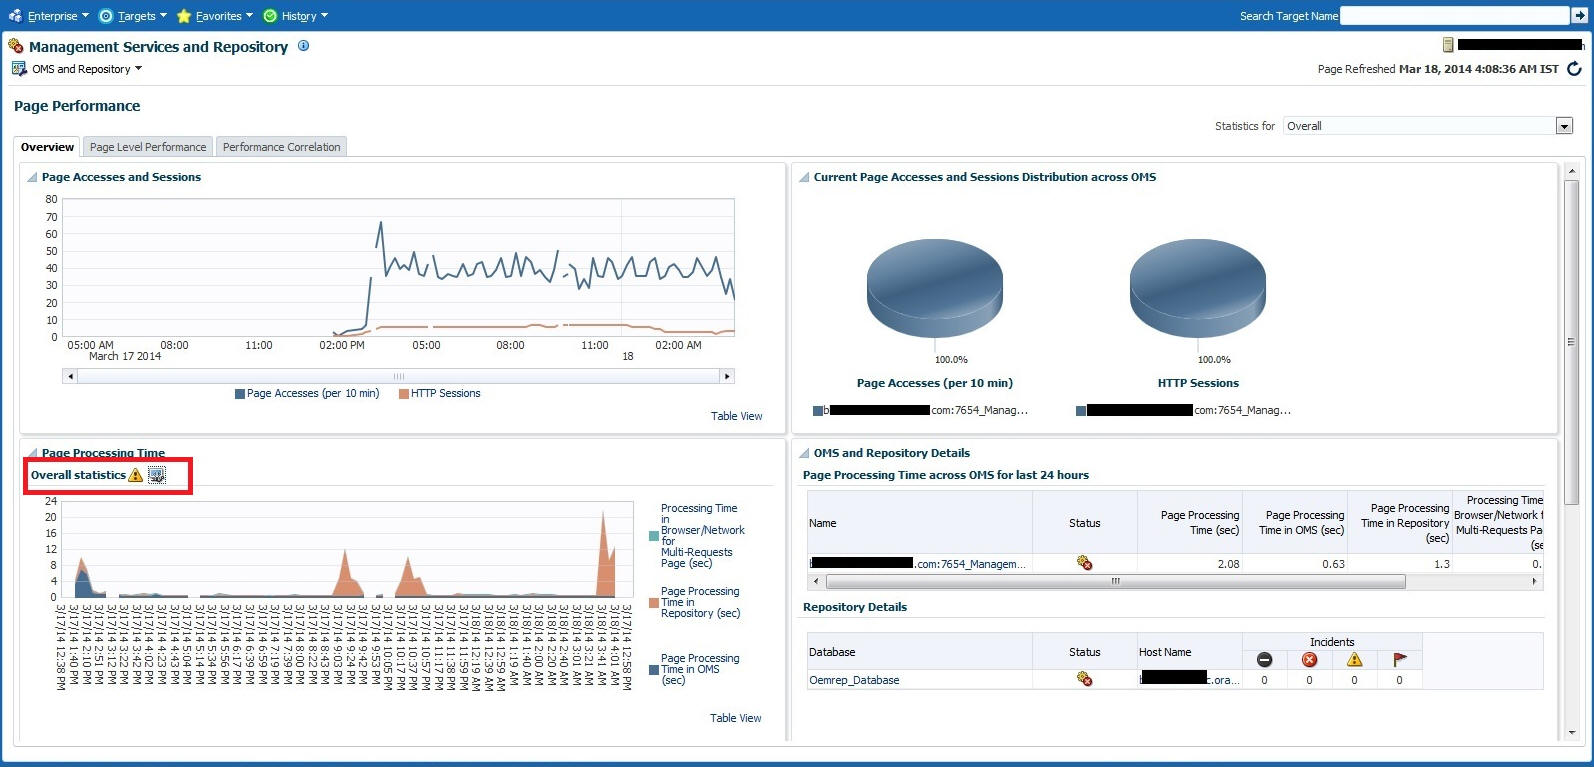
Symptom diagnosis can be performed for both overall page processing time and individual page times. Symptom diagnosis is triggered when the set metric thresholds for overall page processing time are exceeded. Diagnosis is accessed by means of an icon in the Overview tab in the Overall Statistics section when the overall page performance threshold is exceeded, as shown in the following graphic.
Figure 19-1 Symptom Diagnosis Icon
For individual pages, the symptom diagnosis icon is displayed in the table in the Current Severity column if the page performance metric threshold is exceeded.
When the icon is displayed in the Overall Statistics section, it indicates that the overall performance of the Enterprise Manager pages has exceeded the threshold in the last 10 minutes. Clicking on the icon, you are taken to another tab where the details of the diagnosis are presented. The diagnosis indicates the root cause for the overall page performance exceeding the metric threshold, the findings that were deduced on diagnosis and the checks that were performed to analyze the overall page performance issue.
The checks are performed at the database level, middle-tier level and the browser/network level to isolate which part of the system might be the cause of the issue. Each check is analyzed and the checks that are identified as the top causes are reported as findings. The topmost finding is then reported as the root cause for the performance issue.
Target Availability Symptom Diagnosis:
Symptom diagnosis can be performed on the availability of the Agent as well. The icon is displayed in the Agent List and Agent Home pages in the event that the Agent target is unreachable or in pending status.
Figure 19-2 Agent List Page
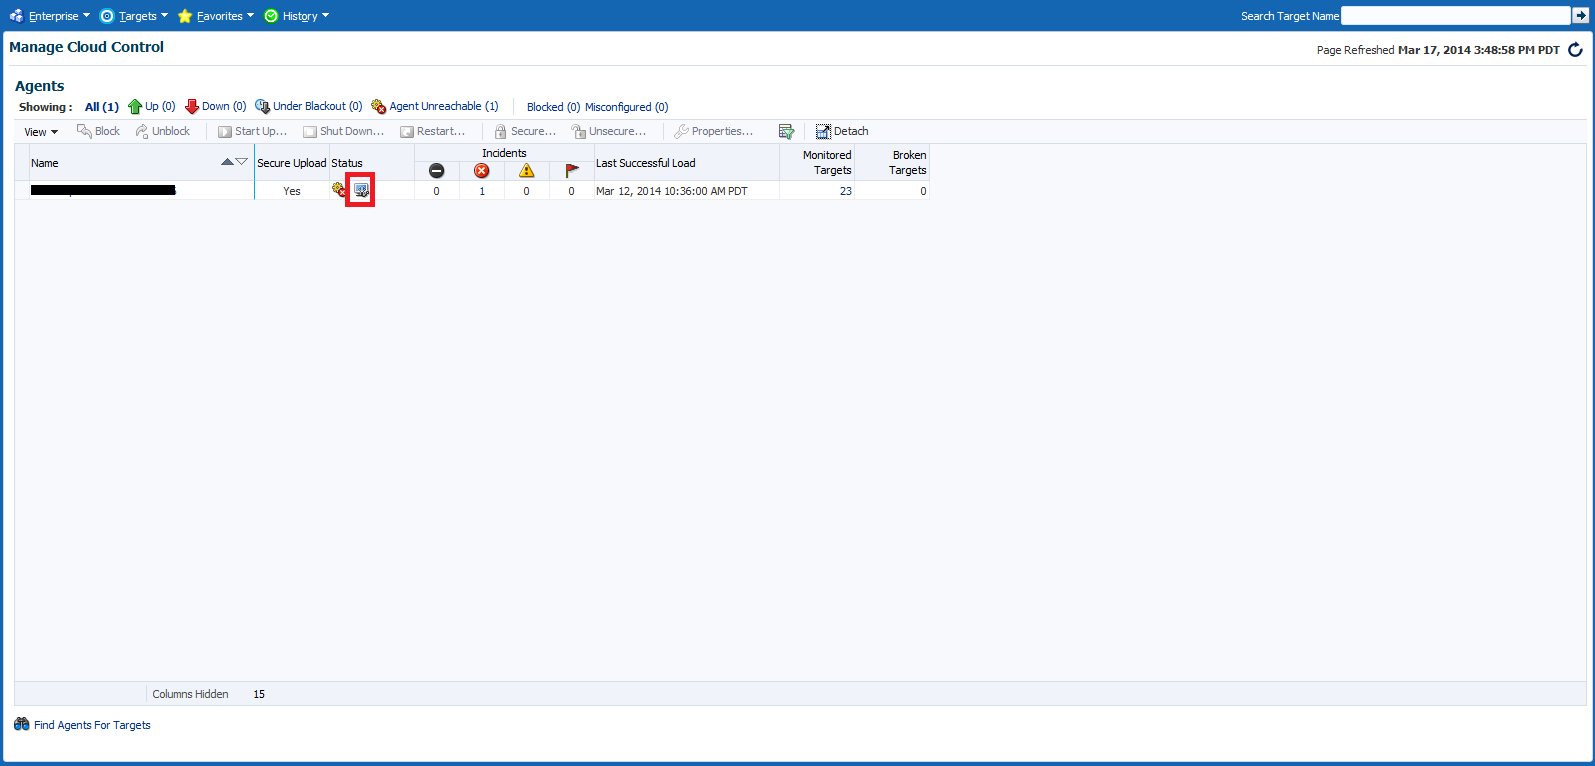
Figure 19-3 Agent Home Page
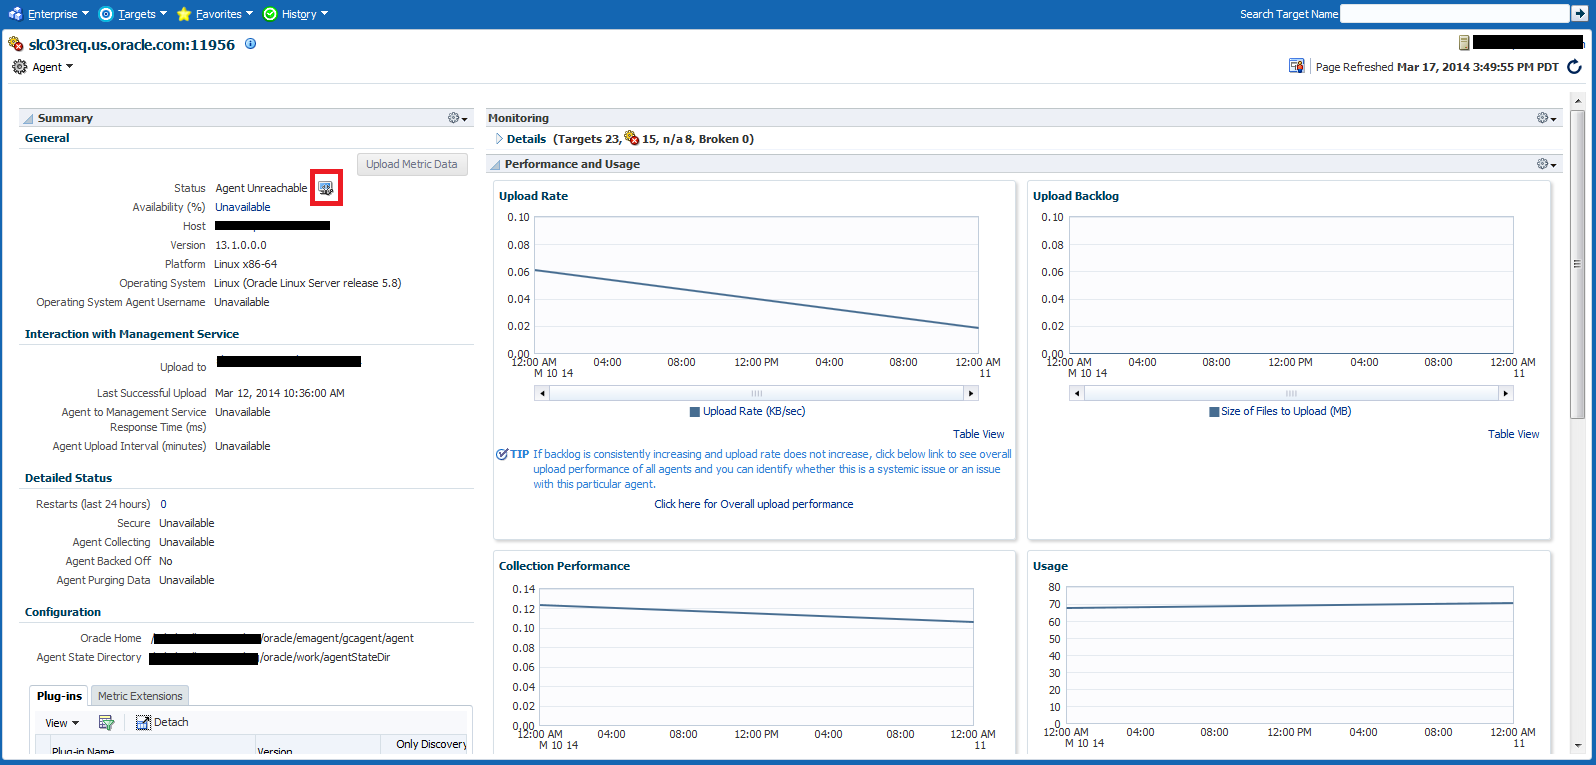
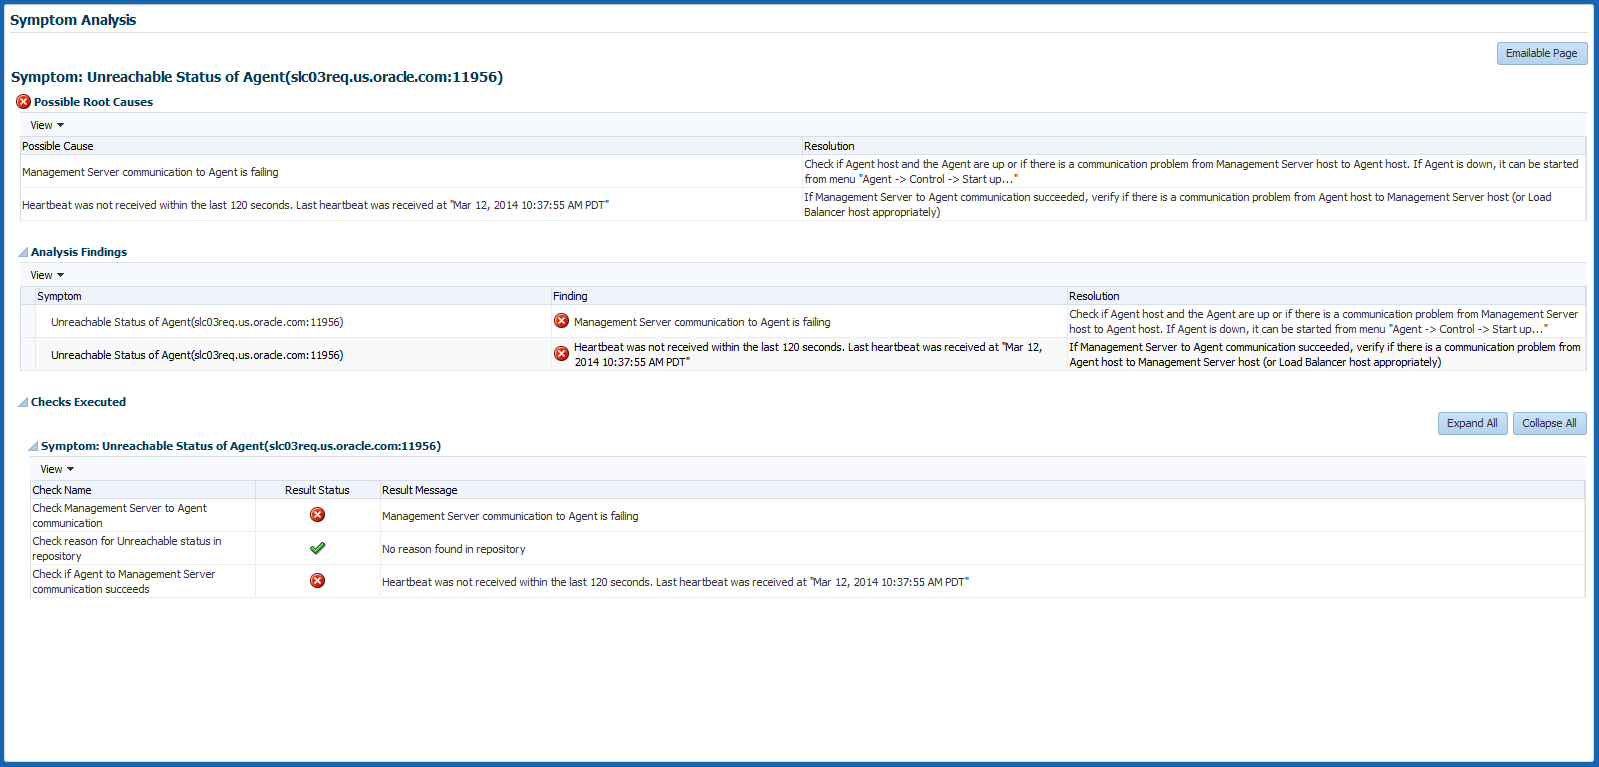
On clicking the icon, the user is navigated to another tab where the details of the diagnosis are presented. The diagnosis indicates the root cause for the Agent's unreachable/pending state, the findings that were deduced from the diagnosis and the checks that were performed to analyze the Agent availability issue.
The checks performed to diagnose the issue consist of the following:
-
if the communication between the Management Service and the Agent is successful
-
if the Agent has communicated with the Management Service
-
if reasons can be deduced from the Repository
-
if further reasons can be deduced by performing checks from the Agent side (whether communication between the OMS and the Agent exists).
Each check is analyzed and the checks that are identified as the top causes are reported as findings. The topmost finding is then reported as the root cause for the performance issue.
Figure 19-4 Agent Symptom Diagnosis
Note:
If communication between the OMS and Agent cannot be established, then the diagnosis will report findings based on the data available in Management Repository, which may not be the real cause for the issue.
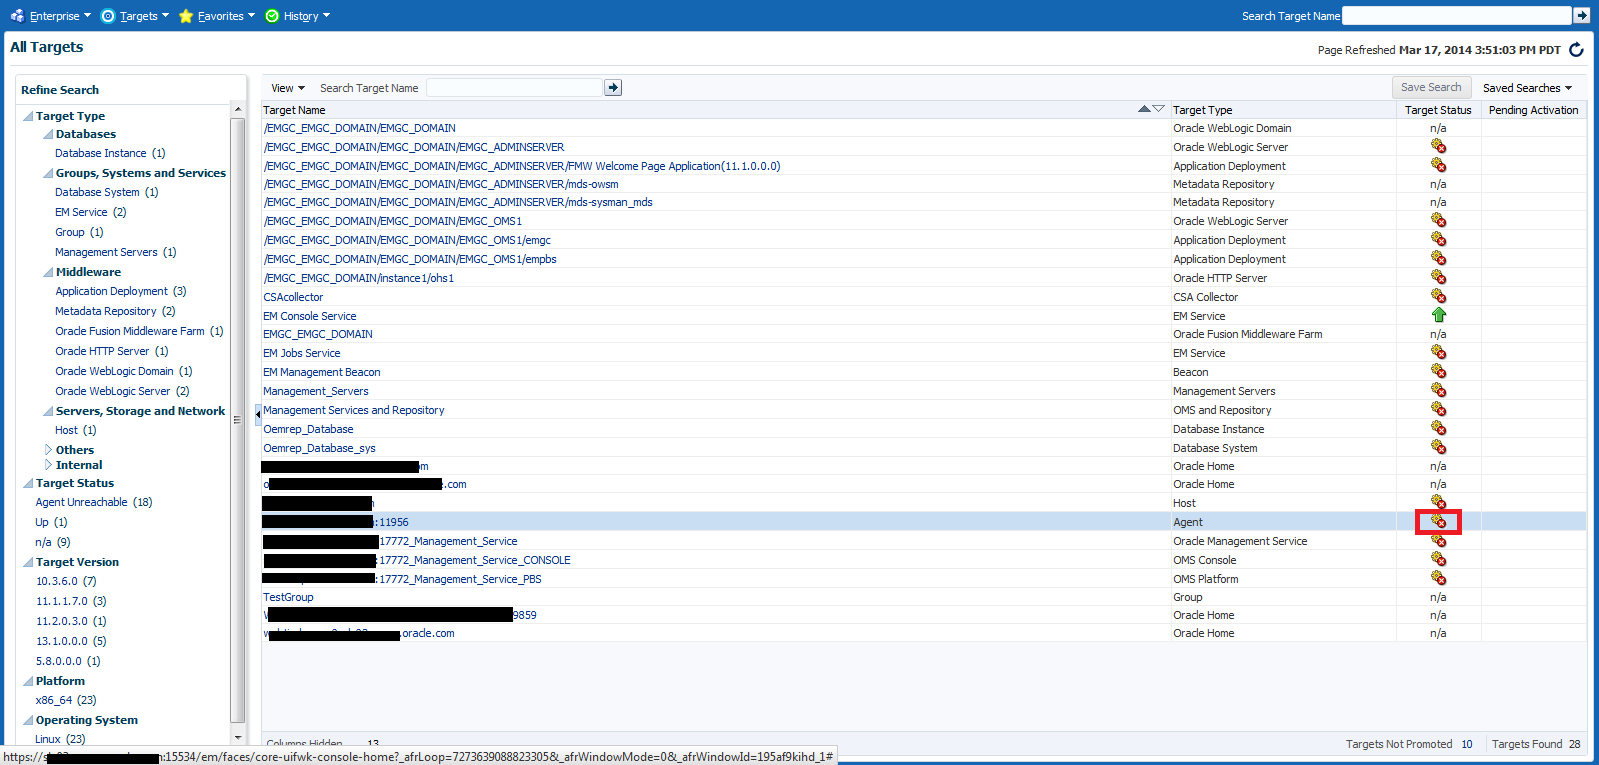
The symptom diagnosis feature is also available in the All Targets page for targets in unreachable or pending status by clicking on the status icon.
Figure 19-5 All Targets Page
