19.3 Repository
The Repository page provides you with an overview of the status and performance of the Repository DBMS Jobs that handle part of Enterprise Manager's maintenance and monitoring functionality. These DBMS jobs run within the Management Repository and require no user input. Charts showing the key Repository Details and Backlog in Repository Collection are provided The Scheduler Status region provides the status of the scheduler and the number of Job Queue Processes.
Accessing Repository Information
From the Setup menu, select Manage Cloud Control and then Repository.
Three tabs are displayed providing a comprehensive view of repository attributes, performance, as well as access to requisite operational parameters.
19.3.1 Repository Tab
As shown in **INTERNAL XREF ERROR**, the Repository tab provides a comprehensive snapshot of repository-specific monitoring.
Repository Details
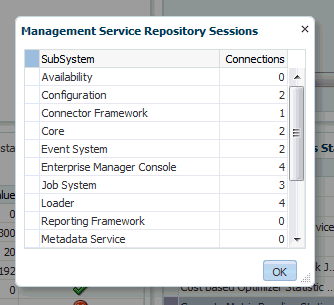
The Repository Details region provides high-level database information for the Enterprise Manager repository. From this region, you can click on the number Management Service Repository Sessions details to view the exact number of repository connections per individual Enterprise Manager subcomponent such as the event system, console, job system, or connector framework.
Figure 19-6 Repository Sessions Per Subcomponent
Incidents and Problems
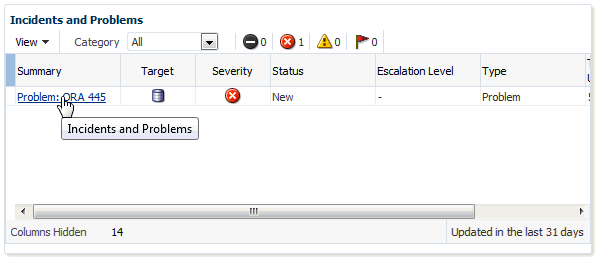
The Incidents and Problems region displays all incidents an problems associated with the repository database. For more detailed incident or problem information, you can click on the Summary link to access the issue in Incident Manager.
Figure 19-7 Accessing Incident/Problem Information
Initialization Parameter Compliance for Instance
This region displays the currents initialization parameter settings, recommended standards, and whether the current parameter values comply with those standard values.
Figure 19-8 Initialization Parameter Compliance
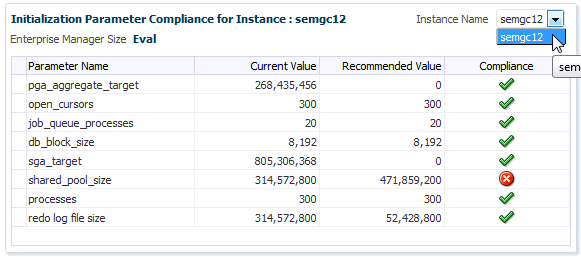
If you are running the repository in a RAC environment, this region also lets you select individual database instances in order to view initialization parameter compliance for that specific instance.
Repository Scheduler Job Status
The Repository Scheduler Jobs Status region provides details of the DBMS Jobs regarding their status, duration, and the next scheduled run time.
Figure 19-9 Repository Scheduler Job Status Region
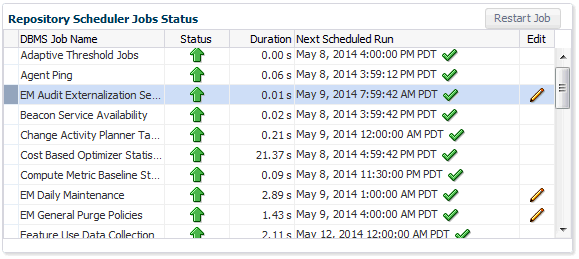
If the Status of a job is down, you can run the job again by clicking Restart Job.
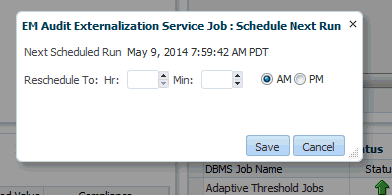
For high-cost jobs requiring greater resources that, when run, can reduce repository performance, an edit icon (pencil) appears in the Edit column. Clicking on the icon displays a dialog allowing you to reschedule the next run time.
Figure 19-10 Job Reschedule Dialog
Repository Collection Performance
The Repository Collection Performance region provides information on the performance of repository collections. They are collected by background DBMS jobs in the repository database called collection workers.
Figure 19-11 Repository Collection Performance Region
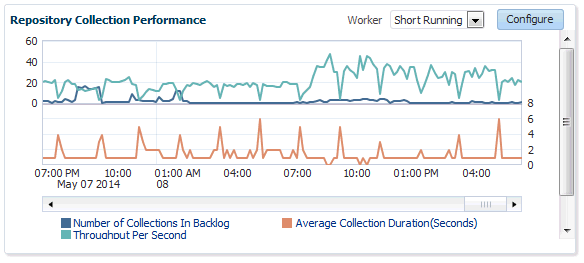
Repository metrics are sub-divided into long and short running metrics. These are called task classes (short task class and long task class). Some collection workers process the short task class and some process long task class. Repository collection performance metrics measure the performance data for repository metric collections for each task class. This metric is a repository metric and hence collected by the collection workers.
You can select between Short Running and Long Running collection workers. When viewing Short Running workers, you can click Configure to change short worker settings.
Figure 19-12 Short Worker Configuration Dialog
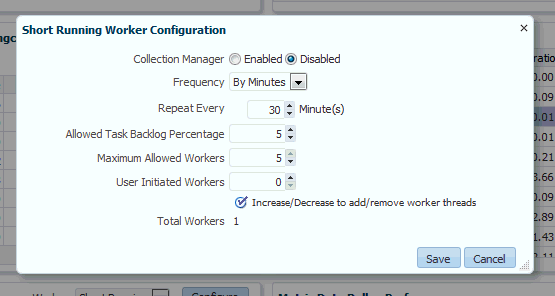
Clicking Save submits a job to change the worker configuration. For this reason, the change will not be instantaneous and may require a minute or so in order to take effect.
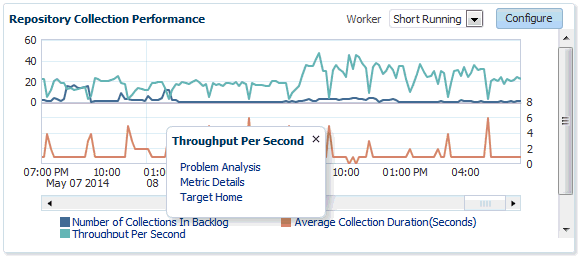
Clicking on an item in the legend allows you to drill down into Problem Analysis, Metric Details, or the Target Home.
Figure 19-13 Collection Performance Information
Metric Data Rollup Performance
This region displays the rollup performance by graphically displaying the quantity of data being rolled up (Number of Records Rolled Up) and speed (Throughput per Minute) over time.
Figure 19-14 Metric Data Rollup Performance Region
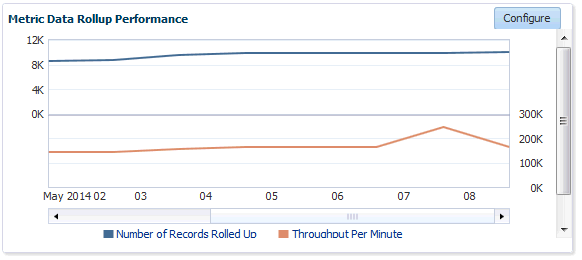
The graphs for Number of Records Rolled Up and Throughput per Minute may increase over time as more targets are added, but on a daily basis should remain about the fairly level. Large spikes could indicate that agents are not communicating properly to the OMS
Clicking Configure allows you to change the number of rollup worker threads that will be started.
19.3.2 Metrics Tab
The Metrics tab provides a graphical rollup of key repository performance measurements. Information includes:
-
Top 25 Metric Data Loading Target Types In Last 30 Days
-
Top 10 Data Loading Metrics In Last 30 Days
-
Metric Alerts Per Day In Last 30 Days
-
Top 10 Metric Collection Errors By Target Type In Last 30 Days
Figure 19-15 Metrics Tab
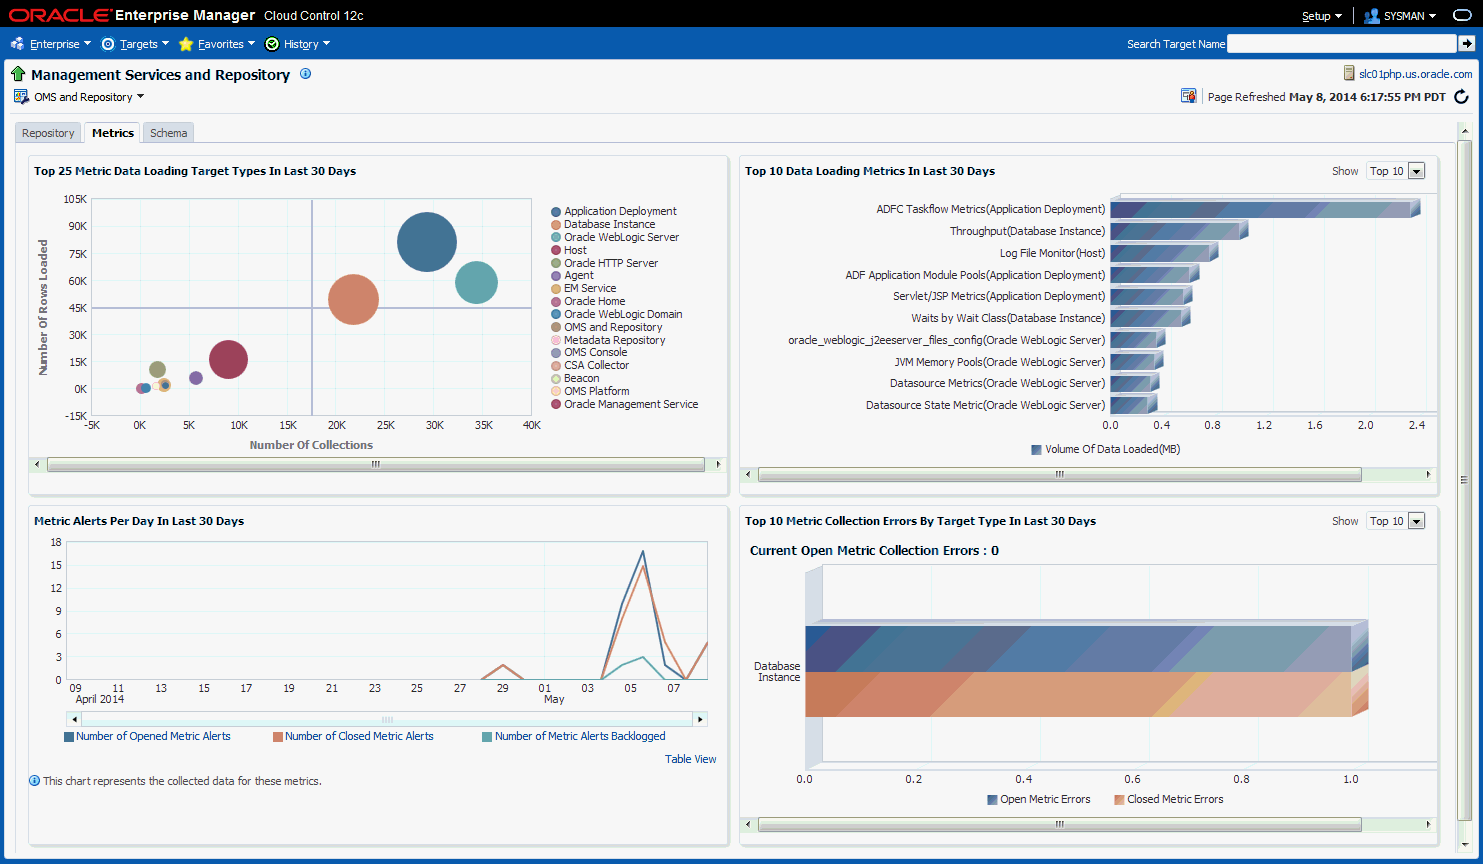
The graphs allow you to drill down to access information in greater detail.
Top 25 Metric Data Loading Target Types In Last 30 Days
Figure 19-16 Top 25 Metric Data Loading Target Types In Last 30 Days
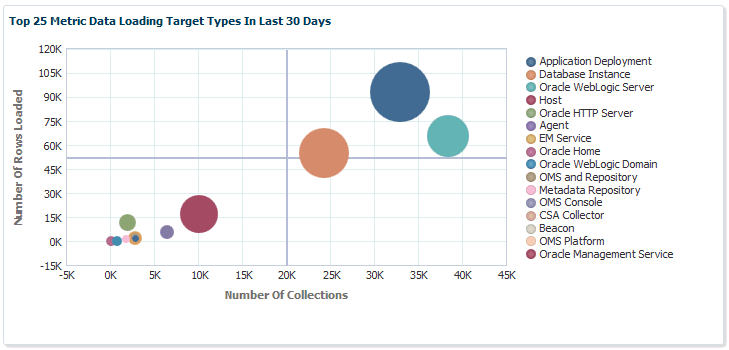
If you wish to view only metrics for a specific target type, click on a specific metric target type area within the graph. A new graph displays showing only metrics for that specific target type. You have the option grouping the results by metric or target.
Figure 19-17 Top 25 Metric Data Loading for a Single Target Type
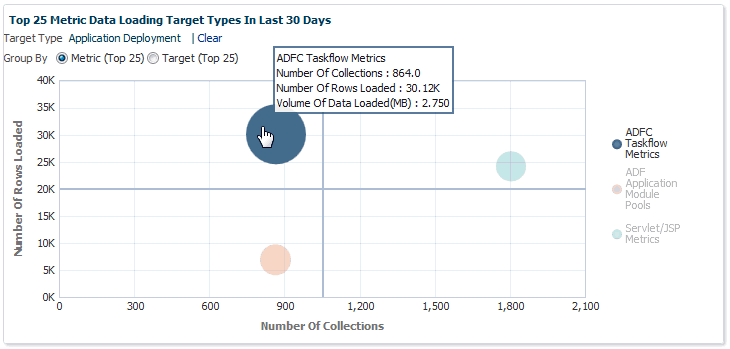
Click Clear to return to the original graph containing all target types.
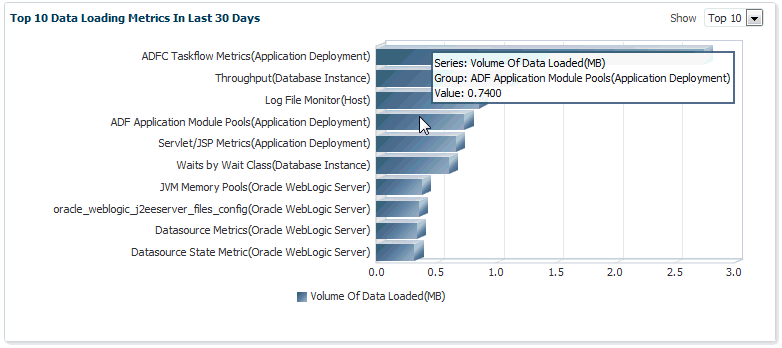
Top 10 Data Loading Metrics In Last 30 Days
Figure 19-18 Metric Data Load Volume
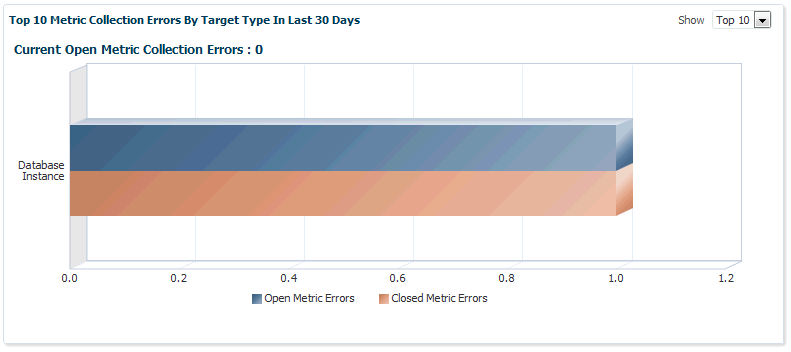
Top 10 Metric Collection Errors By Target Type In Last 30 Days
Figure 19-19 Open Metric Collection Errors
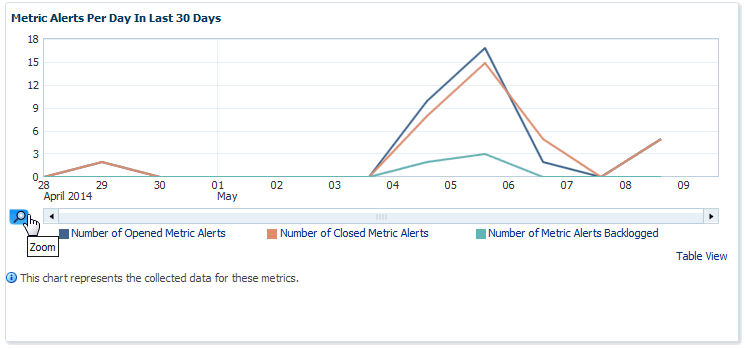
Metric Alerts Per Day In Last 30 Days
The Metric Alerts Per Day In Last 30 Days graphically displays the number of open, closed, and backlogged metric alerts over time. If you wish to focus on a narrower time span, click Zoom.
Figure 19-20 Metric Alerts Per Day
19.3.3 Schema Tab
The Schema tab provides physical attribute and performance data pertaining to the repository database schema. Information includes:
-
Tablespace Growth Rate
You can select the specific tablespace: MGMT_TABLESPACE, MGMT_ECM_DEPOT_TS, or MGMT_AD4J_TS. Top 20 Large Tables/Indexes are also displayed.
-
Top 20 Tables with Unused Space in Repository
-
Purge Policies
-
Partition Retention