17 Monitoring End-to-end Performance
This chapter includes the following sections:
The demonstration uses the stand-alone versions of RUEI.
You can view a live demonstration of the case study described in this chapter by navigating to the following site:
17.1 Troubleshooting: A Case Study
This demonstration aims to traverse all the functional layers of a distributed application. Only partial views of screens are shown.
Looking at the User Experience
Our investigation begins with the RUEI dashboard, the first place to review the overall user experience.
Looking at the Top usage by User ID panel, we note a very high percentage of Error page views for the users Harold and Edward:

To get more details about this situation, we select to display browser data by clicking on the cube icon in the upper-right hand corner.
From the Browser data display, we select a user and select user diagnostics to get session diagnostics for the user, filtering on a specific application, in this case the Toyco application.
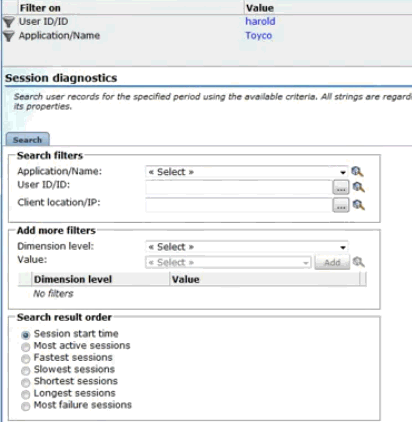
Next, we retrieve session information for the user for a given time period. The results are displayed in the Session diagnostics pane:
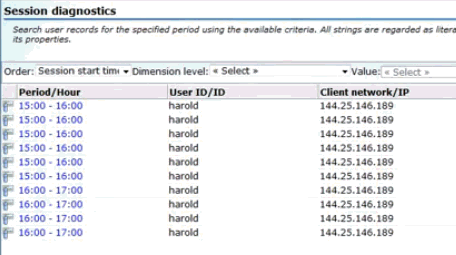
We select one of the session listed in the grid view to find out more about the session. Information is displayed in the Session activity pane.

We see that one of the load times is excessive and that there's an error listed as well.
We click on the page icon in the Info column to view the page as the user saw it. It is shown next. Indeed, at the bottom of the page is the error message "Purchase failed."
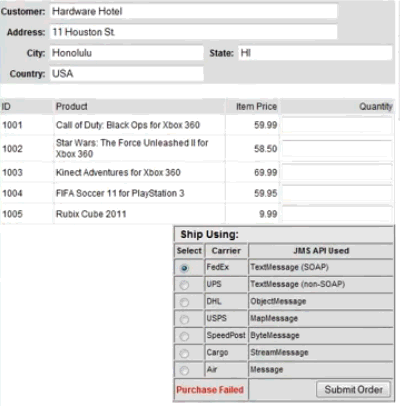
The error message in the user view suggests that this is a functional error.
Looking at Diagnose transaction
Selecting the problematic application and selecting Diagnose transaction from the context menu displays the Instance inspector view.
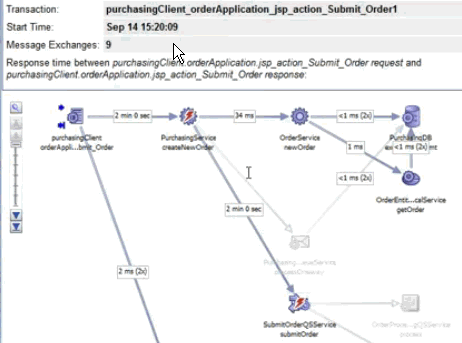
The red thunderbolt icons identify the failing services.
Suspecting that the call to the database is the culprit, we take a look at the message content, which suggests that the trouble is in the message response.

Choosing to view the XML, we find ourselves in a Java stack trace, and we see a fault string:
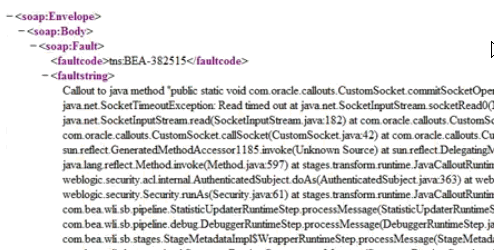
We'll need to drill down to the Java Virtual Machine Diagnostics page.
We return to the transaction graph and right-click on the offending operation to get the JVMD view.
Looking at Machine-Level Information
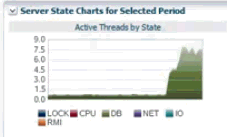
Looking at the Active Threads by State graph in the JVMD view, it looks like we have a database problem.
Looking at the Threads State Transition display on the same page, we note that a number of threads are stuck.
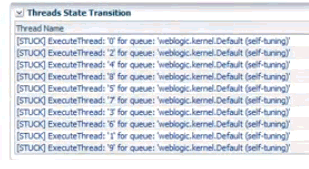
Noting that this is a current problem, we select the Live Thread Analysis button to get more information.
In the Live Thread Analysis display, we see ten threads waiting for the database, with three of them locked.
We can drill down to the database by selecting the State (DB Wait) link. This page shows us the SQL details.
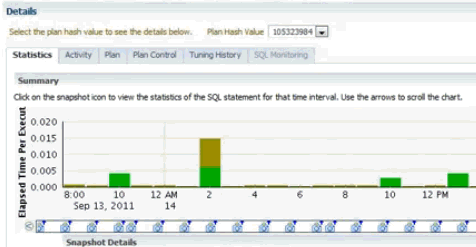
The display confirms our suspicion that the trouble lies with database access.
This ends the troubleshooting session, which traversed all the layers of distributed application performance: from the user layer, to back-end supporting services, to the underlying infrastructure.
17.2 Finding Solutions
See if you can guess the answer to the following questions, which test your understanding of end-to-end performance monitoring.
Is the problem with my application?
The following problems relate either to the user experience or to back-end services.
-
Are users unable to complete a task?
Look at statistics for user flows in RUEI.
-
Do I have a memory leak?
Look at heap analysis information in JVMD for a given time period.
-
Am I getting out-of-bounds values?
Check SLA-based alerts defined for RUEI.
Is the problem with deployment architecture?
-
Do I need to replicate and load-balance services?
Check high throughput values for transaction links. These might indicate bottlenecks.
-
Do I need a failover scheme?
Use the Enterprise Manager Business Applications page or the Business Application home page to check for servers that are often unavailable.
Is the problem with supporting infrastructure?
-
Is a server down or slow?
Use the Enterprise Manager Business Applications page or the Business Application home page to check for servers that are often unavailable.
-
Is thread-lock causing services to fail?
Use the JVM Diagnostics page in Enterprise Manager to get information about executing threads.
-
Is the network slow?
Look at NetworkWait information in the JVM Diagnostics page in Enterprise Manager.
-
Are any of my routers down?
If you have included your routers in the definition of your System for Enterprise Manager, you can get information about these in Enterprise Manager.