15 Getting Detailed Execution Information
There are times when the views offered by RUEI is not sufficient to understand performance issues. If the suspect services are executing in a Java Virtual Machine, it is possible to go deeper and get detailed execution information that helps you diagnose the root cause of such problems.
JVM Diagnostics is a tool that allows you to view the details of an executing JVM process. These details include the stack frames for executing threads, thread state information, aggregate information about the frequency and cost of method execution, information regarding the holding of Java and database locks, and details about the objects in the Java heap. Using this tool you can also access historical data for each JVM monitored.
This chapter includes the following sections:
When you invoke one of these views from RUEI to further analyze performance, Enterprise Manager selects and displays data generated in the time interval for the selected RUEI page object operation instance. One additional piece of information that might be shown for the data displayed is its execution context ID (ECID).
An ECID is an identifier used to track a request, for components in the Oracle technology stack. The creation and propagation of ECIDs enable the sharing of context and of diagnostic data between components. ECIDs are also used to identify threads running in the Java Virtual Machine. Where ECIDs are available, they can help you correlate data shown in RUEI with data shown in the JVM Diagnostics view or Request Instance Diagnostics view. For additional information, see Using ECIDs to Track Requests.
To access JVM views from RUEI, you must do some preliminary set-up work. For more information, see Setting up End-to-end Monitoring.
JVMD offers a rich set of features that we cannot hope to describe in a single chapter. For complete information about its use, see the chapters describing JVMD in this book.
15.1 Using JVM Diagnostics
Java Virtual Machine Diagnostics (JVMD) information is accessed in one of the following ways:
-
In the Message Log tab for a service, endpoint, logical operation, physical operation, or transaction. Right-click on a row and select Drilldown to JVMD from the context menu.
-
In the Transaction Instance Inspector, right click on an operation (in either the graph or grid view), and select Drilldown to JVMD from the context menu.
-
In the Message Search Log tool, right click on a message row, and select Drilldown to JVMD from the context menu.
In Enterprise Manager, you can access JVMD information for a transaction operation by selecting a transaction in the Business Application and opening the transaction summary page. Then do one of the following:
-
Right click one of the operation nodes in the topology diagram and select JVMD diagnostics from the context menu.
-
Right click one of the operation rows in the operations table and select JVMD diagnostics from the context menu.
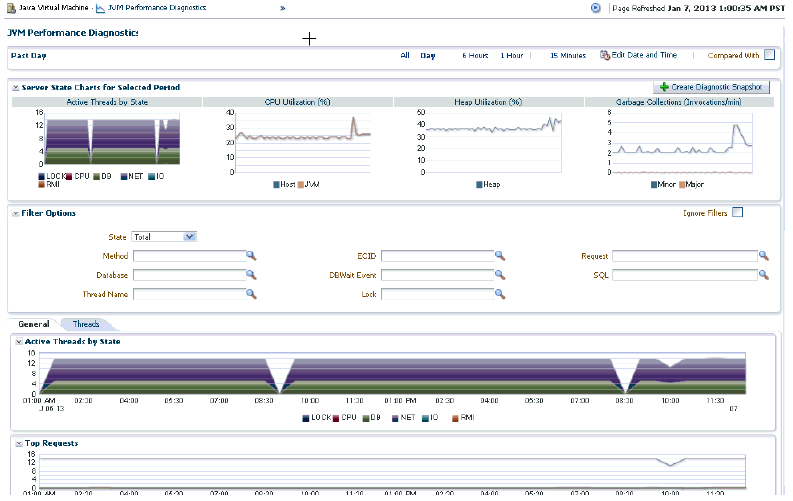
In each case, a new window is displayed showing the JVM Performance Diagnostic view. In the multi-VM case, JVMD shows a VM group target and aggregate information for the group. Figure 15-1 shows the JVM Performance Diagnostic view.
Figure 15-1 JVM Performance Diagnostic View

This view shows the summary details of the JVM in which the selected operation is running. It shows Server state charts, Active Threads by State, Top Methods, Top Requests, Top DBWait Events, TopSQLs, and Top Databases. You can filter the data that is displayed by specifying various criteria.
Click on the Threads tab to view the Thread State transition chart. This chart shows how the threads have transitioned from one state to another in the selected period. Click on a bar graph in the Thread State Transition chart to view the Sample Analyzer, which provides a detailed analysis on the thread of the thread.
Click the Live Thread Analysis control to see all threads running in the JVM. Click on a thread to view additional information about that thread.
15.2 Using Request Instance Diagnostics
You can access the Request Instance Diagnostics (RID) view either from RUEI.
-
From the RUEI stand-alone application, the ECID is used to correlate the data shown. You can access RID by a right-click on a record in a RUEI session diagnostics view.
-
From a RUEI Session Diagnostics, object view in EM, you can access RID by a right-click on the Oracle logo icon. (The icon is displayed only if there's an ECID)
Note:
Java Virtual Machine Diagnostics (JVMD) must be installed and active before you can access the Request Instance Diagnostics (RID) view.
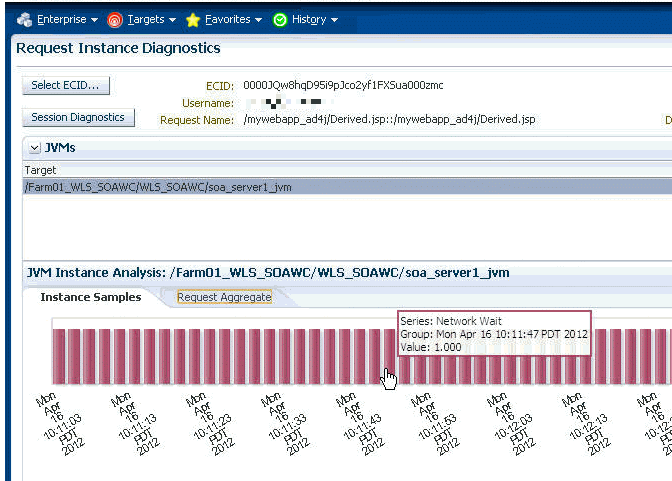
Figure 15-2 shows part of the Request Instance Diagnostic view for a given ECID.
Figure 15-2 The Request Instance Diagnostics View

The JVMs panel lists all the JVMs through which the request was executed. Select a JVM to display the following information:
-
RID: The Relationship ID, an ordered set of numbers describing the location of each task in the tree of tasks.
-
The start time and the duration of the request.
-
Step Name: The individual steps in the request. For example, the first step could be jsp, the second could be EJB, and the third could be DB.
-
CPU utilization by the JVM
-
GC Major/Minor indicates the number of objects added to the major and minor garbage collections.
If you select a JVM from the list, a bar graph is displayed in the Instance Samples tab of the JVM Instance Analysis panel. This graphs shows the thread state in each JVM snapshot taken within the duration of the request. A color key, to the right of the display, indicates a different thread state; Runnable, Lock, IO wait, DB Wait, NW wait, and RMI Wait. Hover over the graph to get an in-depth view of the thread.
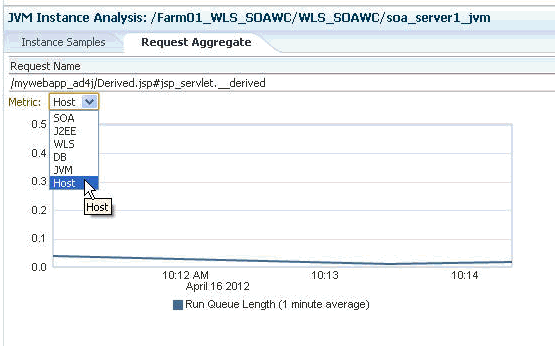
To view aggregate metrics collected for the selected JVM during the specified period, click on the Request Aggregate tab. Figure 15-3 shows a sample tab.
To view measurements for a given metric type, select the desired type from the drop down Metric menu, as shown in the figure.
Figure 15-3 RID: Request Aggregate Tab.
