21 Troubleshooting JVM Diagnostics
It contains the following:
21.1 Cross Tier Functionality Errors
This section lists the errors that show the status of the JVM Diagnostics Engine. Cross tier functionality errors may occur due to the following:
-
Mismatched database connection information
-
Insufficient user privileges
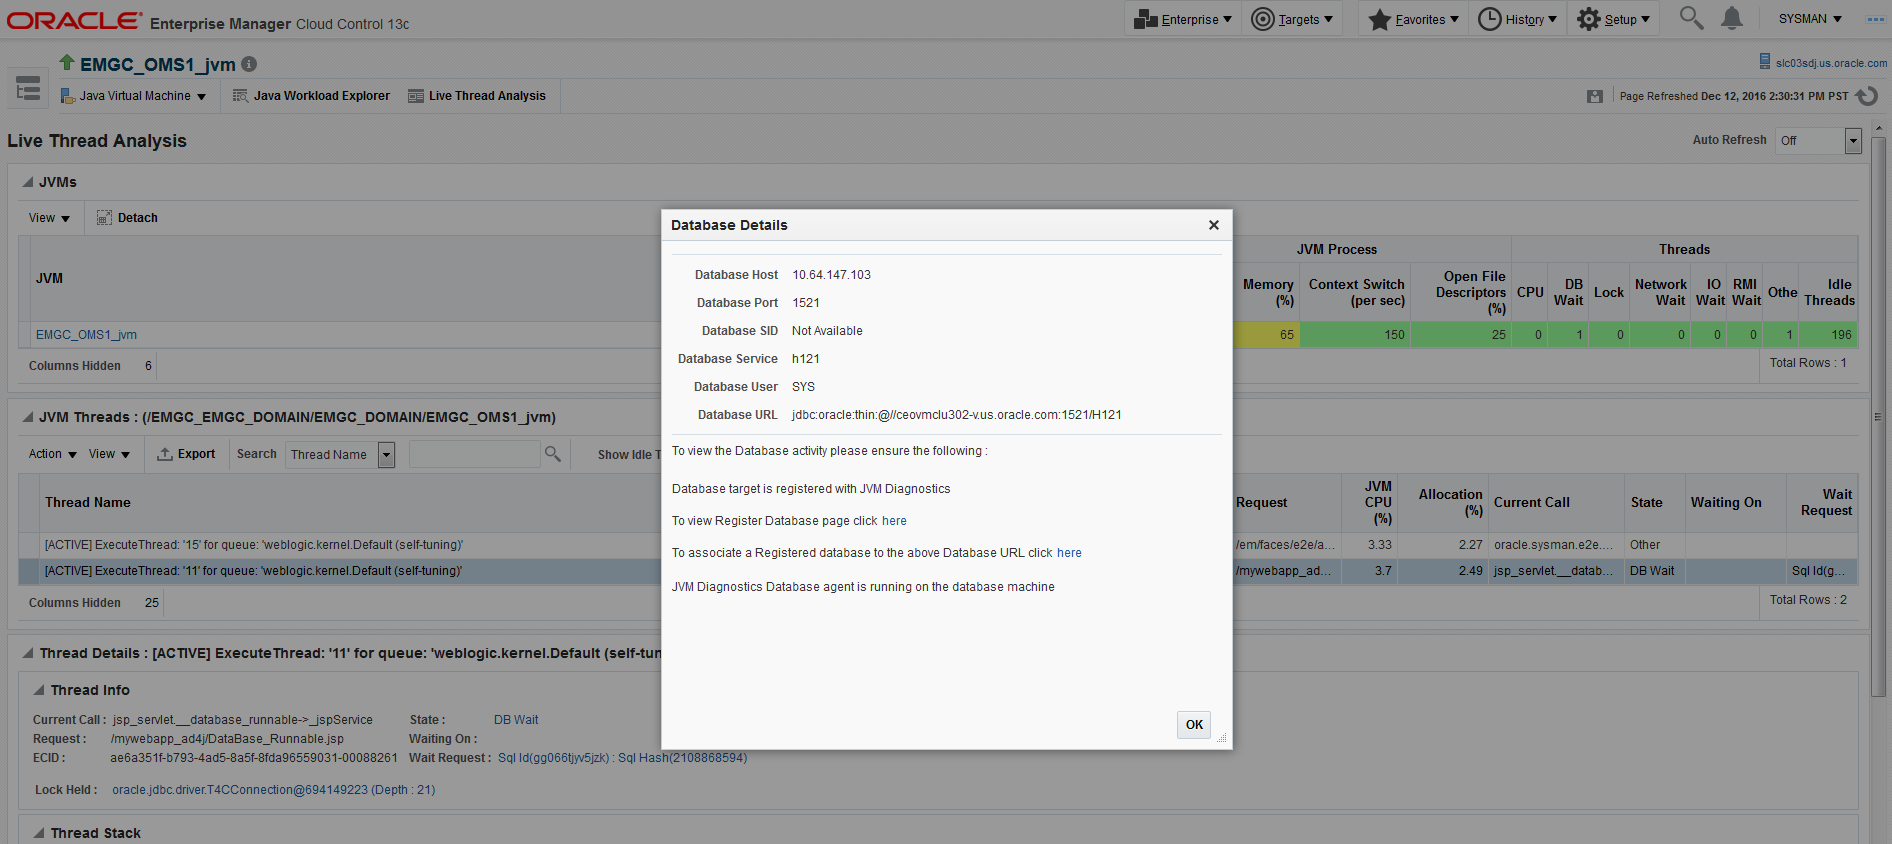
In the Performance Diagnostics page, if the Top SQLs / Top DBWait Events graph contains Unknown entries and the Top Databases graph contains Non-Defined entries, and the Database Details popup window appears when you click the DB Wait link in the Live Thread Analysis page, cross tier correlation cannot be established.
Figure 21-1 Live Thread Analysis (Cross Tier)
Note:
If cross tier correlation is successful, when you click on the DB Wait link in the Live Thread Analysis page, the Database Diagnostics page for the database instance is displayed. In this case, the Top SQLs / Top DBWait Events and Top Databases graphs in the JVM Performance Diagnostics page will not contain Unknown and Not Defined entries respectively. For custom databases, the DB Wait link is not enabled.
Solution:
-
If cross tier correlation cannot be established due to database mismatch, check if the database has been registered. From the Setup menu, select Middleware Management, then Application Performance Management. Select a JVM Diagnostics Engine and click Configure. Click the Register Databases tab and check whether the database has been registered. If the database has not been registered, click the DBWait link to examine the JDBC connection string and verify if it matches the database registered with JVM Diagnostics. For example, if the JDBC connection string contains SID, the database registered needs to have SID. Similarly, the service name, and the hostname of the database in the JDBC connection string must match that of the registered database. Another example of such information that requires matching is the hostname of the database.
-
If it is a custom database, the user may have insufficient privileges. In this case, check whether the user has permissions on the
v$active_services,v$instance,v$session,v$sqltext,v$process, andv$session_waittables. -
If JDBC URL returned by JVM Diagnostics Agent is for one of registered databases, but cross tier correlation cannot be established due to database mismatch, wrong host name, and so on, the JDBC URL must be associated with a registered database(s). You can associate a JDBC URL with a database from the following pages:
-
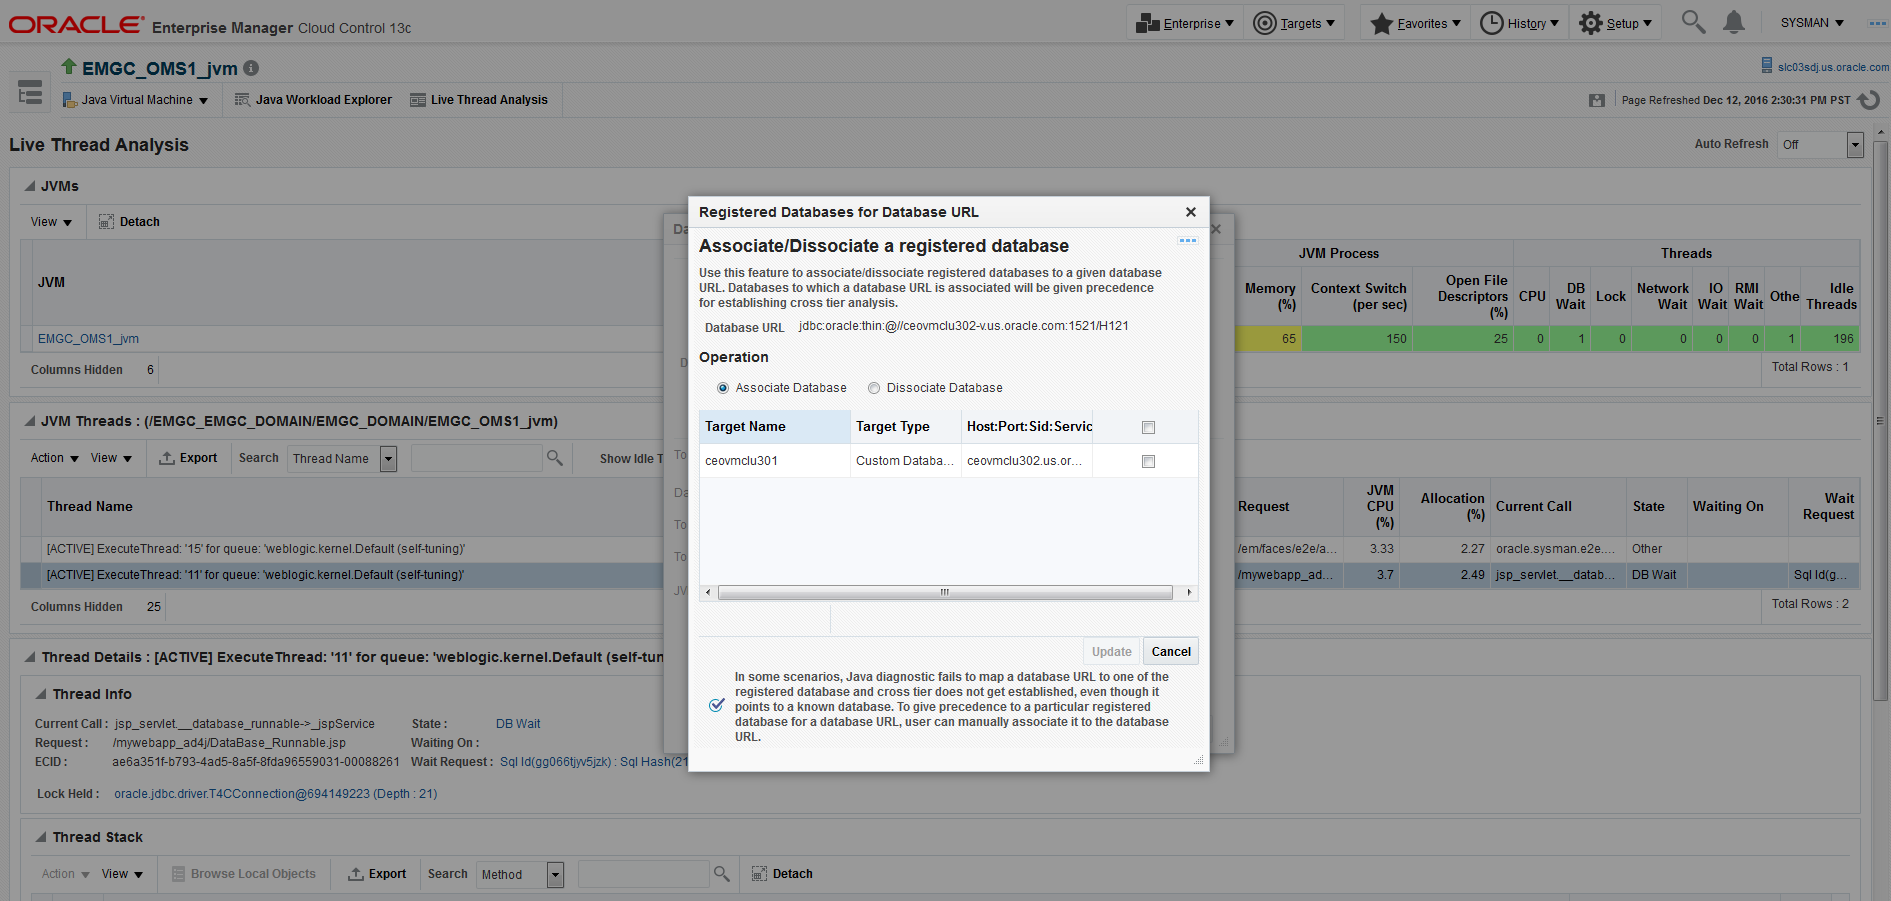
Live Thread Analysis Page: From the Java Virtual Machine menu, select Live Thread Analysis. In the JVM Threads table, select a thread that is in the DB Wait state and click Manage DB URL. In the Associate / Disassociate a Registered Database, select a JDBC URL and click Add and specify the URL of the registered database with which is to be associated.
Figure 21-2 Live Thread Analysis: Associate / Disassociate a Registered Database
-
Java Workload Explorer: Provides a detailed view of all performance statistics associated with the JVM or JVM Pool.
-
Registered Databases Page: From the Setup menu, select Middleware Management, then select Application Performance Management. Select the JVM Diagnostics Engine row in the Application Performance Management Engines table and click Configure.
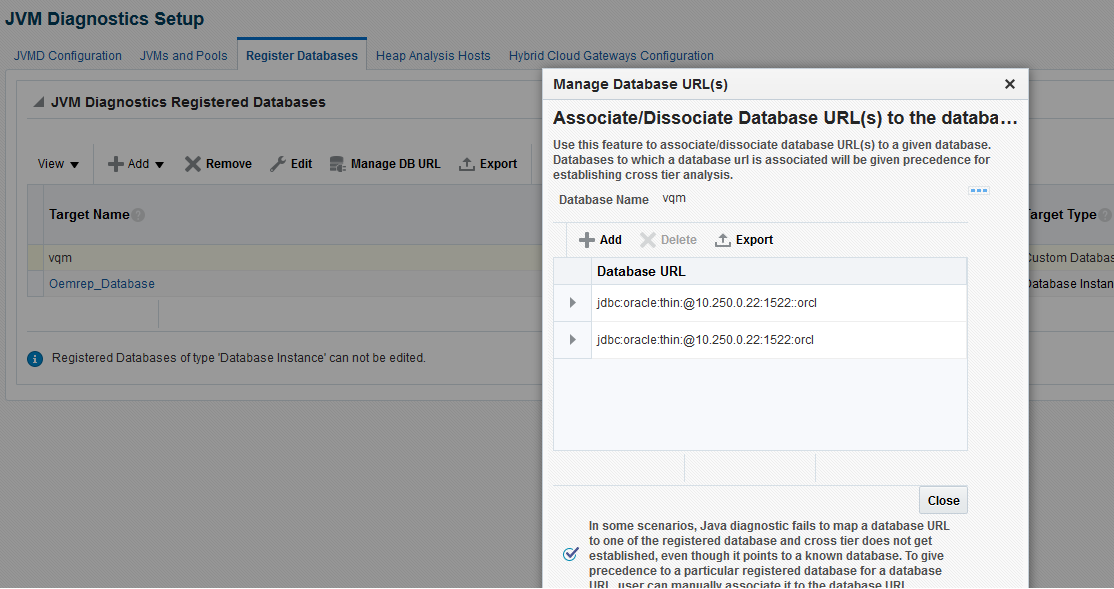
Click the Register Databases tab. The JVM Diagnostics Registered Databases page appears. The list of registered databases is displayed. Select a database and click Manage DB URL. In the Associate / Disassociate a Registered Database, select a Database URL and click Add and specify the URL of the database to be associated.
Figure 21-3 Setup: Associate / Disassociate a Registered Database
-
-
If cross tier correlation cannot be established due to mismatch of the JVM Diagnostics Agent host name with the machine name stored in
V$ESSIONtable of the database (for instance, inconsistent logical naming of machine), do the following:-
Update the v
$SESS_MACHINEcolumn of thejam_jvmtable in the Enterprise Manager repository (for example,update jam_jvm set V$SESS_MACHINE = 'JVMD Agent Machine name' wherejam_jvm_id ='jam_jvm_id') with the right value as specified in theV$SESSIONof the database).
-
-
If cross tier correlation cannot be established as the database is inaccessible to the JVM Diagnostics Manager, check the database name in the log file and check if the database is down or inactive, the Listener is down. If this is the case, the JVM Diagnostics Manager cannot connect to the database to establish the cross tier correlation.
If, after following all the above steps, cross tier correlation still cannot be established, you need to purge the JVMD Manager log file (*.out). From the Setup menu, select Middleware Diagnostics and then select Engines And Agents. Select a JVM Diagnostics Engine and click Configure and temporarily set the JVMD Engine Log Level and Cross Tier Log Level to Trace.
Turn the monitoring off temporarily (if possible) and navigate to the Live Thread Analysis page when the application is making DB calls (There should be at least on Thread in Db wait) and send the JVMD Manager logs to report the issue. Return to the previous log level and turn monitoring on again.
21.2 Trace Errors
This section lists errors that occur during tracing. The following error occurs if the Poll Duration has a large value and causes a timeout.
Error: weblogic.transaction.internal.TimedOutException: Transaction timed out after 30 seconds.
Solution: This error does not affect the Trace functionality and can be ignored.
21.3 Deployment Execution Errors
This section lists the errors that occur when you run the deployment script.
-
Error: Script Exception: Error occurred while performing deploy: The action you performed timed out after 600,000 milliseconds.
Solution: To resolve this issue, check if the lock for the target WebLogic domain Administration Console has already been acquired. If it has been acquired, release it and run the script again by following these steps:
-
Login to the WebLogic Administration Console: http://<machine address>:<webogic port>/console.
-
Check if there are any pending changes. If any changes are pending, activate or undo these changes as appropriate and run the script again.
-
-
Error: If the user name and password for the WebLogic Administration Server are incorrect, you may see the following error:
Caused by: java.lang.SecurityException: User: <username>, failed to be authenticated.This message is typically embedded in a long error message trail.
You may also see the following exception:
javax.naming.AuthenticationException [Root exception is
java.lang.SecurityException: User: weblogic, failed to be authenticated.]
at weblogic.jndi.internal.ExceptionTranslator.toNamingException(ExceptionTranslat
or.java:42)
at
weblogic.jndi.WLInitialContextFactoryDelegate.toNamingException(WLInitialContextFactoryDelegate.java:788)
at
weblogic.jndi.WLInitialContextFactoryDelegate.pushSubject(WLInitialContextFact
oryDelegate.java:682)
atweblogic.jndi.WLInitialContextFactoryDelegate.newContext(WLInitialContextFactoryDelegate.java:469)
at
weblogic.jndi.WLInitialContextFactoryDelegate.getInitialContext(WLInitialConte
xtFactoryDelegate.java:376)
at weblogic.jndi.Environment.getContext(Environment.java:315)
at weblogic.jndi.Environment.getContext(Environment.java:285)
at
weblogic.jndi.WLInitialContextFactory.getInitialContext(WLInitialContextFactor
y.java:117)
at javax.naming.spi.NamingManager.getInitialContext(NamingManager.java:235)
at
javax.naming.InitialContext.initializeDefaultInitCtx(InitialContext.java:318)
at javax.naming.InitialContext.getDefaultInitCtx(InitialContext.java:348)
at javax.naming.InitialContext.internalInit(InitialContext.java:286)
at javax.naming.InitialContext.<init>(InitialContext.java:211)
Solution: Enter the correct user name and password for the WebLogic Administration Server and run the script again.
-
Error: This exception may occur, either if the path to the
weblogic.jaris invalid, or the user does not have read permissions on theweblogic.jarfile.Exception in thread "main" java.lang.NoClassDefFoundError: javax/enterprise/deploy/spi/exceptions/TargetException Caused by: java.lang.ClassNotFoundException: javax.enterprise.deploy.spi.exceptions.TargetException at java.net.URLClassLoader$1.run(URLClassLoader.java:200) at java.security.AccessController.doPrivileged(Native Method) at java.net.URLClassLoader.findClass(URLClassLoader.java:188) at java.lang.ClassLoader.loadClass(ClassLoader.java:307) at sun.misc.Launcher$AppClassLoader.loadClass(Launcher.java:301) at java.lang.ClassLoader.loadClass(ClassLoader.java:252) at java.lang.ClassLoader.loadClassInternal(ClassLoader.java:320)
Solution: Ensure that the correct path is provided or the user credentials allow read access to the jar file.
-
Error: If the WebLogic Administration Console is locked, the agent deployment job may not work as expected. You will see a message that the
agent.logfiles cannot be deployment since the WebLogic Domain is locked.Solution: JVM Diagnostics Agents are deployed by using t3/t3s protocols. Make sure the t3/t3s ports are open.
-
Error: If you are deploying to an SSL enabled WebLogic Domain using the demo certificate, you may see an error if the WebLogic Server demo certificate has not been imported to the keystore.
Solution: You must import the WebLogic Server demo certificate to the keystore of the Management Agent that is monitoring the WebLogic Server target.
-
Error: While copying the
deployer.ziporjavadiagnosticagent.earfiles, errors like broken pipe appear.Solution: The Oracle Management Service and the Management Agent must be installed by the same user or users belonging to the same group.
-
Error:
JVMD AGENT DEPLOYMENT FAILED FOR WEBLOGIC 9.2 TARGET.The following exception occurs:
EM Agent home : /scratch/aime/agsh_0819/core/12.1.0.2.0
MIDDLEWARE_HOME : /scratch/aime/mw923
IS_WEBLOGIC9 : true
em agent state dir : /scratch/aime/agsh_0819/agent_inst
acsera home : /tmp/ad4j_1345730608009/4910760210525348050
wls admin url : t3://emHost.example.com:7001
wls username : weblogic
target : AdminServer?
weblogic jar path :
/scratch/aime/mw923/weblogic92/server/lib/weblogic.jar&&ls
/scratch/aime/mw923/weblogic92/server/lib/wljmxclient.jar&&ls
/scratch/aime/mw923/weblogic92/server/lib/wlcipher.jar
application name : HttpDeployer?
agent keystore location :
/scratch/aime/agsh_0819/agent_inst/sysman/config/montrust/AgentTrust.jks
Command used for deployment:
/scratch/aime/agsh_0819/core/12.1.0.2.0/jdk/bin/java -cp
/tmp/ad4j_1345730608009/4910760210525348050/ADPAgent/lib/mips.jar:/scratch/aim
e/mw923/weblogic92/server/lib/weblogic.jar&&ls
/scratch/aime/mw923/weblogic92/server/lib/wljmxclient.jar&&ls
/scratch/aime/mw923/weblogic92/server/lib/wlcipher.jar
-Dweblogic.security.SSL.ignoreHostnameVerify=true
-Djava.security.egd=file:/dev/./urandom
-Dweblogic.security.SSL.trustedCAKeyStore=/scratch/aime/agsh_0819/agent_inst/
sysman/config/montrust/AgentTrust.jks-Dsun.lang.ClassLoader.allowArraySyntax=
true -Dbea.home=/scratch/aime/mw923
com.acsera.ejb.Deployer.RemoteHttpDeployerShell -deploy -adminurl
t3://emHost.example.com:7001 -upload -source
/tmp/ad4j_1345730608009/4910760210525348050/ADPAgent/deploy/HttpDeployer.ear
-targets AdminServer? -username weblogic -name HttpDeployer?
-usenonexclusivelock
The application will be first undeployed on the targeted server
Usage:
java [-options] class [args...](to execute a class)
or
java [-options] -jar jarfile(to execute a jar file)
where options include:
d32 use a 32-bit data model if available
-d64 use a 64-bit data model if available
-client to select the "client" VM
-server to select the "server" VM
-hotspot is a synonym for the "client" VM [deprecated]
The default VM is server,
because you are running on a server-class machine.
-cp <class search path of directories and zip/jar files>
-classpath <class search path of directories and zip/jar files>
A : separated list of directories, JAR archives,
and ZIP archives to search for class files.
-D<name>=<value>
set a system property
-verbose[:class|gc|jni]
enable verbose output
-version print product version and exit
-version:<value>
require the specified version to run
-showversion print product version and continue
-jre-restrict-search | -jre-no-restrict-search
include/exclude user private JREs in the version search
-? -help print this help message
-X print help on non-standard options
-ea[:<packagename>...|:<classname>]
-enableassertions[:<packagename>...|:<classname>]
enable assertions
-da[:<packagename>...|:<classname>]
-disableassertions[:<packagename>...|:<classname>]
disable assertions
-esa | -enablesystemassertions
enable system assertions
-dsa | -disablesystemassertions
disable system assertions
-agentlib:<libname>[=<options>]
load native agent library <libname>, e.g. -agentlib:hprof
see also, -agentlib:jdwp=help and -agentlib:hprof=help
-agentpath:<pathname>[=<options>]
load native agent library by full pathname
-javaagent:<jarpath>[=<options>]
load Java programming language agent, see
java.lang.instrument
-splash:<imagepath>
show splash screen with specified image
/scratch/aime/mw923/weblogic92/server/lib/wljmxclient.jar
ls: invalid line width: eblogic.security.SSL.ignoreHostnameVerify=true
Status returned from the java process is 512
21.4 LoadHeap Errors
This section lists loadheap errors.
-
Error: The following error occurs during the heapdump operation.
glibc detected * free(): invalid next size (fast): 0x0965d090" ./loadheap.sh: line 237: 32357 Aborted ./bin/${bindir}/processlog in=$infile hdr=${sumdata} obj=${objdata} rel=${reldata} root=${rootdata} osum=${objsumdata} rrel=${rootrel} heap=${heap_id} skip=$skipgarbage db=$dbtype $* Error processing file /tmp/heapdump6.txtSolution: Check if the heapdump operation has been successfully completed. Open the
heapdump6.txtfile and check if there is a heapdump finished string at the end of the file. If you see this string, load the finished dump file. -
Error: Heapdump already in progress, cannot take another heapdump.
Solution: Check if the heapdump operation has been successfully completed. Open the
heapdump6.txtfile and check if there is a heapdump finished string at the end of the file. -
Error:
loadheap.shcreated unusable unique indexes.Solution: Run the
loadheap/sql/cleanup.sqlshipped withloadheap.zipto fix the unique indexes.
21.5 Heap Dump Errors on AIX 64 and AIX 32 bit for IBM JDK 1.6
The following error occurs when you try to deploy the JVM Diagnostics Agent on IBM JDK 1.6:
Error: The following can occur when the JVM Diagnostics Agent is deployed on JDK 1.6.
Jam Agent : can_tag_objects capability is not set. Copy /tmp/libjamcapability.so
to another directory and restart Java with argument -agentpath: <Absolute path of
libjamcapability.so>
Solution: Deploy the latest jamagent.war and add -agentpath:<Absolute path of libjamcapability.so after copying to another directory> to the java arguments.
-
This message appears only after the JVM Diagnostics Agent has connected to JVM Diagnostics Engine. Secondly, this argument should be a JVM argument (and not a program argument).
-
If the server is started using the WebLogic Administration Console (through nodemanager). these arguments can be specified in the Administration Console under Server Start. If the server is started from the command line (
startWeblogic.shorstartManagedServer.sh), these arguments have to be specified in thestartWeblogic.sh. If there are multiple servers, make sure a check for the server name is present in thestartWeblogic.shto ensure that the path for thelibjamcapability.sois separate for each server. -
A sample entry to be made in
startWeblogic.shis below:if [ "${SERVER_NAME}" = "AdminServer" ] ; then echo "********************************************* MODIFIED ADMIN SERVER" JAVA_OPTIONS="${JAVA_OPTIONS} -agentpath:<Absolute path of libjamcapability.so.X after copying to another directory> export JAVA_OPTIONS fi -
The message "Capabilities Added by libjamcapability.so" during server startup (before the jamagent logs appear) confirms that
libjamcapability.sowas loaded fine.
21.6 Errors on JVM Diagnostics UI Pages
This section lists the user interface errors.
-
Error: This is an Agent timeout error:
JAM Console:Socket timed out after recv -- client emHost.example.com:7001
is not Active [0] secs
JAM Console jamlooptimeout=[3]
JAM CONSOLE: JVM 1 is not active
JAM Cons ErrProcessing Request:128 JVM 1 is not active jamDAL: jamreq returned
128 return status < 0 from jamDalInst.processRequest
Solution: To resolve this error, increase the Agent Request Timeout (secs) and Agent Loop Request Timeout (secs).
-
Error: The JVM Diagnostics Agent is up and running but is not displayed in the real time pages.
Solution: If the log file shows
JAMMANAGER: OLD AGENTorNULL POOLor wrong optimization level, this indicates that the old JVM Diagnostics Agent or Dbagent is being used. To resolve this issue, follow these steps:-
From the Setup menu, select Application Performance Management.
The list of Application Performance Management Engines is displayed.
-
Select the JVM Diagnostics Engine row, click Configure then click the Register Databases tab.
-
Click the Downloads button in the Registered DB Agents region, and select JVMD Agent from the JVMD Component list. Specify the JVM Diagnostics Agent
web.xmlparameters, click Download, then click OK to download thejamagent.war.
-
-
Error: You do not have the necessary privileges to view this page.
Solution: Ensure that you have the required JVM Diagnostics Administrator or User privileges to view the JVM Diagnostics data.
21.7 Frequently Asked Questions
This section lists some of the questions you may have while using JVM Diagnostics. It includes the following:
21.7.1 Location of the JVM Diagnostics Logs
You can find the JVM Diagnostics logs in the following locations:
-
The JVM Diagnostics Engine Log file is located at
<path to gc_inst>/em/EMGC_OMS1/sysman/log/jvmdlogs/jvmdengine.log.0 -
UI related errors are logged in:
-
$T_WORK/gc_inst/user_projects/domains/GCDomain/servers/EMGC_OMS1/logs/EMGC_OMS1.out -
$T_WORK/gc_inst/user_projects/domains/GCDomain/servers/EMGC_OMS1/logs/EMGC_OMS1.log
-
-
Communication errors between the JVM Diagnostics Engine and the Console are logged in
$T_WORK/gc_inst/em/EMGC_OMS1/sysman/log/emoms.log
21.7.2 JVM Diagnostics Engine Status
To check the status of the JVM Diagnostics Engine, follow these steps:
-
From the Setup menu, select Middleware Diagnostics, then click Engines And Agents.
-
Check the JVM Diagnostics Agent log file to verify the connection between Agent and the Manager. If you see an error -
JAM Agent ERROR: Cannot connect to Console:Connection refused, this indicates that the JVM Diagnostics Engine is not running. -
Check if the message
JAM Console: Agent connection from:[Hostname]is present in the JVM Diagnostics Engine log file. If this message appears, it indicates that the JVM Diagnostics Engine is running and is connected to the Agent.
21.7.3 JVM Diagnostics Agent Status
To check the status of the JVM Diagnostics Agent:
-
From the Targets menu, select Middleware, then click on a Java Virtual Machine target. Select the Live Thread Analysis option from the Java Virtual Machine menu. Check the JVM Status in the Connected JVMs table.
-
If the status is Not Active, this indicates that the Agent is not connected to the Manager. Check the agent logs to verify if it is running and the IP address and port number of the Manager is correct.
-
If the status is No JVMD Agent Deployed, the JVM Diagnostics Agent must be deployed on that JVM.
-
-
If the JVM Diagnostics Agent is running, the active threads data must be visible. If the JVM Diagnostics Agent is not running, you will see a message -
JVM is inactive, Please try again after some time.
21.7.4 Monitoring Status
To verify if the JVM Diagnostics Engine is monitoring the data:
- From the Setup menu, select Middleware Diagnostics, then click Engines And Agents in the Middleware Diagnostics page. In the JVMD Configuration page, verify that the Enable Monitoring check box is checked.
- Navigate to the Monitoring page under Setup and check if monitoring status is On for the Pool to which the JVM being monitored belongs.
- Navigate to the JVM Pools page under Setup and verify if the Poll Enabled check box has been checked for the Pool to which the JVM being monitored belongs. Monitoring should now be enabled.
21.7.5 JVMD SLB Configuration
The JVM Diagnostic engine may go down due to the following reasons:
-
SLB is not configured properly.
-
OMS port was blocked by firewall.
To make JVMD engine accessible, OMS port must be unblocked and accessible by SLB.
The below figure shows the JVMD SLB configuration on Enterprise Manager console.
Figure 21-4 JVMD SLB Configuration

Virtual Server on SLB
SLB Virtual server port: 4901 aixcs2.us.oracle.com
IP Address configured in virtual server of SLB: 10.242.182.114
The figure below shows the virtual server configuration details on SLB:
Figure 21-5 Virtual Server on SLB
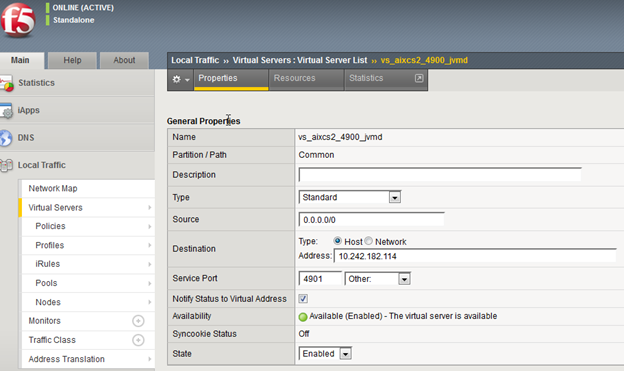
Go to Resources tab and note down the Default pool. Now, open the Pools menu in the Local Traffic panel, and go to Members tab. Each active member indicates an OMS configured in the EM.
For example, in the figure below, we have only one OMS. Hence, we have only one active member. You must make sure that the member host has correct properties as OMS host and OMS SSL port.
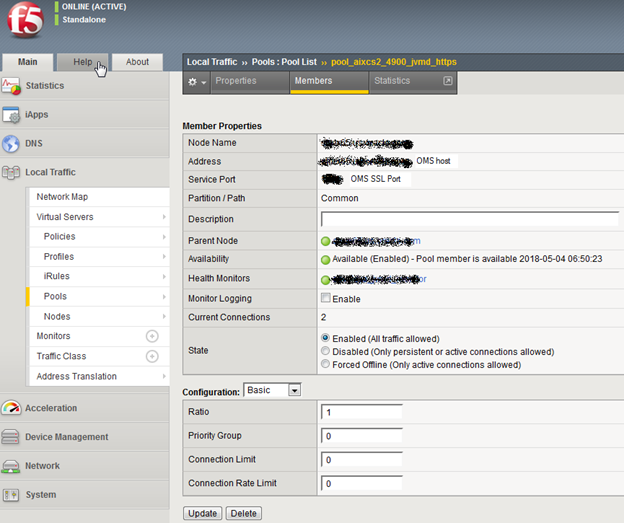
For more information about configuring the F5 SLB for EM and JVMD, see Configuring OMS High Availability with F5 BIG-IP Local Traffic Manager.
21.7.6 Running the create_jvm_diagnostic_db_user.sh Script
You can run the create_jvm_diagnostic_db_user.sh script if you want to create less privileged users who can only load heaps using the loadHeap script.
21.7.7 Usage of the Try Changing Threads Parameter
This parameter should be used only when the JVM is highly active.
21.7.8 Significance of Optimization Levels
The JVM Diagnostics Agent supports three optimization levels:
-
Level 0 indicates that the JVM Diagnostics Agent is using a JVMTI based engine. This level is supported for JDK 6 series on almost all supported platforms.
-
Level 1 is a hybrid between level 0 and level 2. It is supported only for very few JDKs on selected platforms.
-
Level 2 uses Runtime Object Analysis technique for monitoring as it is efficient at run time.
21.7.9 Custom Provisioning Agent Deployment
You can customize the JVMD Agent deployment in the production environment by running custom provisioning scripts.
After the OMS has been installed, the jvmd.zip file can be found in the plugins/oracle.sysman.emas.oms.plugin_12.1.0.0.0 directory in the Middleware installation directory. The zip file contains a set of scripts in the customprov directory. Details on using these scripts are described in the README.TXT present in the same directory. To use the custom provisioning scripts, follow these steps:
- From the Setup menu, select Middleware Management, then click the Engines And Agents and on top right click Download Jvmd Agent to download the
jamagent.warfile. - Make a copy of the deployment profile that includes the location of the downloaded
jamagent.war, domains, and server details. - Run the
Perl scripton the deployment profile which will deploy the JVMD Agent to all the specified servers.
21.7.10 Log Manager Level
The default log manager level is 3. You can temporarily increase this to a higher level if you encounter some issues. Log levels 1 to 5 are supported where:
-
1 - Error
-
2 - Warning
-
3 - Info
-
4 - Debug
-
5 - Trace
21.7.11 Repository Space Requirements
For monitoring data, Oracle recommends 50 MB per JVM per day with the default setting of a 24 hour purge interval. This amount can vary based upon runtime factors (e.g depth of call stacks, etc.) within your environment. Hence, you must check the tablespace growth periodically and if required, you may need to change the space requirements. This will ensure that database growth due to standard monitoring will occur smoothly without sudden spikes. Tablespace sizing can be affected by the following:
-
Heap Dumps: Analyzing heaps requires a large amount of tablespace. As a standard practice, we recommend that you must have 5 times the size of heap dump file being loaded in your tablespace. Since you know the size of your dump file, make sure that there is adequate space to accommodate the dump file before it is loaded into the database.
-
Thread Traces: While these are smaller than heaps. they are loaded into the database automatically when a user initiates a trace at the console. The size of these threads can vary dramatically depending on the number of active threads during the trace, the duration of the trace, and the sample interval of the trace. This should usually be under 100MB but if several thread traces have been initiated, it could fill up the database quickly. Before initiating the traces, you must ensure that there is adequate space in the database.