Using Analytics
The Analytics feature provides a view into operating system and zone performance and status. The charts, reports, and utilization data provide details of an individual eligible operating system or zone. You can use the information to analyze the behavior of an operating system to aid in peak performance and to diagnose and correct incidents.
Monitoring uses the Agent Controller to gather information. When an operating system is not an agent-managed system, or it is Microsoft Windows, the software uses an SSH connection from a Proxy Controller to perform remote monitoring. Remote monitoring over an SSH connection limits the available metric information. The Summary view, Process view, Historical view and Virtualization Analytics are not available for these operating systems.
The Analytics view provides information for the following agent-managed platforms:
-
Linux
-
Oracle Solaris 11 and 10 OS
-
Oracle Solaris 10 non-global zone, when the global zone or non-global zone is agent-managed
-
Oracle Solaris 11 non-global zone, when the global zone is agent-managed
When your operating system is agentlessly-managed, information is not available for zones and less information is available for Linux and Oracle Solaris 10 and 11 operating systems. Table 6-4 shows a list of features and whether the feature is supported on an agent-managed or agentlessly-managed asset.
Table 6-4 Supported Analytics Information
| Feature | Supported on Agent Managed OS | Supported on an Agentlessly Managed OS |
|---|---|---|
|
Summary |
Yes |
Yes |
|
Virtualization Analytics for Oracle VM Server |
Yes, for agent-managed guests |
No |
|
Virtualization Analytics for Oracle Solaris 10 Zones |
Yes, for an agent-managed global zone or non-global zone |
No |
|
Services |
Yes |
Yes |
|
Processes |
Yes, for an agent-managed guest, global zone, or non-global zone |
No |
|
Threshold |
Yes |
Yes |
|
History |
Yes, for an agent-managed guest, global zone, or non-global zone |
No |
|
Metrics |
Yes |
Yes |
The current management mode appears in the Dashboard Summary page for the operating system.
Displaying Analytics Information
For each operating system, the information appears in the Analytics tab in the center pane.
The following diagnostic pages are available for an agent-managed operating system:
-
OS Analytics view: Displays analytics details for an operating system.
-
System resource graphs
-
Top-consumers views
-
Processes information
-
View historical data and set thresholds
-
-
Virtualization Analytics view: Displays analytics details for a zone.
-
Virtualized OS instance
-
Breakdown of resource usage of the physical server
-
Running OS instance
-
View historical data and set thresholds
-
Display the Analytics View
Procedure to display the analytics view.
- Select an operating system, zone, or guest in the Navigation pane.
- Click the Analytics tab.
Display the Both the OS Analytics and Zone Analytics Views
Procedure to display OS analytics and zone analytics views.
- Select a global zone that has zones in the Navigation pane.
- Click the Analytics tab to see the OS Analytics.
- Click the Zones Analytics tab to view the Summary, Zones, History, and Resource Pool Utilization for all zones of the global zone.
The Analytics view contains current and historical information about an operating system's use of resources, including CPU, Network, disk I/O, memory, alert history, and total thread and process counts. Information presented in this section assumes that the operating system is agent managed. See Table 6-4 for the list of supported features for an agentlessly managed OS.
The information appears in a series of charts in the following subtabs:
-
Summary: View a high-level overview of the top consumers, by process, for the CPU, memory, network, and disk I/O resources.
-
Processes: View process-specific details.
-
Services: View and monitor Oracle Solaris 10 and 11 SMF services.
-
Thresholds: View and edit the threshold limits for a selected monitored attribute.
-
History: View a history for the top consumers.
-
Metrics: View specific details an operating system element, such as the percentage of memory used.
-
Charts: You can create a variety of utilization charts, define the coordinates, and export the chart data to CSV or XML output.
You can view analytics information for all supported and managed operating systems, both physical and virtual. The information presented varies, depending on the data available for the OS. For example, when the System Tap is not installed on a Linux operating system, information about the top network and I/O consumers might not be available. Also, the top consumers for I/O data might not be available with some versions of the Linux kernel.
When an agent-managed operating system is on a virtualization platform, you can view the information in the Analytics view of the virtualization platform.
Displaying the Analytics Summary
The Summary view provides details for an individual operating system. The Summary provides a graphical representation and a list of the top five (5) resource usage consumers, by process, for the CPU, memory, network, and disk I/O resources.
Click the View icon for a row to display process details.
The following details appear in the Summary view:
-
CPU Utilization: A graph of the percentage of CPU Utilization over time and a detailed list of the top five (5) CPU processes. The list includes the process identification number (PID), name, and CPU Usage %.
-
Memory Utilization: A graph of the top 5 memory processes, including the PID, the process name, and the percentage of memory used.
-
Network Utilization: A graph of the top 5 network processes, including the PID, the process name, and the network usage in Kilobytes (KB) per second.
-
I/O Utilization: A graph of the top 5 I/O processes, including the PID, the process name, and the I/O usage per second.
Oracle Enterprise Manager Ops Center collects information every five minutes on every managed asset and displays the last hour of data on the Summary tab. Each list has an icon before the PID column for each process. Click an icon to view details of the process. The type of resource determines the available details.
-
Process Details: Includes the contract ID, Service FMRI, creator, elapsed time, project name, project ID, and a process tree.
-
Thread Information: Includes the thread's light-weight process (LWP) ID, the number of threads (NLWP), the user, the priority, the state (such as sleeping), the percentage of CPU used, the CPU time, the percentage of memory used, how much memory the process has marked for allocation (VSZ memory), the processors, and the command.
-
Handles: Includes the port details, such as the family, local address, local port, the protocol, remote address, remote port, device, and node.
-
Process Environment: Includes details about the environment, such as the arguments, data model, and flags.
-
Memory Information: Includes physical, virtual, and anonymous memory and dirty page details. Details include the virtual address and the number of KB in the virtual mapping size, the resident physical memory, the anonymous memory, and the dirty pages. The lock status, permissions, and mapping name details are displayed, when available.
Displaying and Configuring Graphs
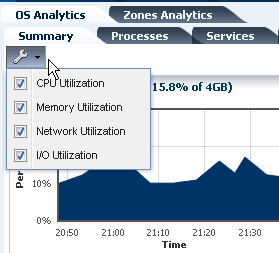
When the icon that looks like a wrench appears on a page with graphs, click the icon to configure the graphs or change the graphs that appear on the page.
Figure 6-9 shows an example where you can choose the system resource graphs that display on the Summary page.
Displaying the Processes View
You can drill down to display process-specific data, based on current data from the operating system. Some data, such as CPU usage, might also be available in the History view.
The following details are available in the Process view:
-
Process ID (PID)
-
Process Name
-
User
-
State
-
CPU Usage %
-
Memory Usage %
-
Physical Memory size in MB
-
Virtual memory size
-
Target
When you click a process in the Processes table, two icons are enabled in the center pane, one to view more details and the other to kill the process. Figure 6-9 shows an example where you can click check boxes to select or deselect system resource graphs from displaying on the Summary page.
When the software is configured to work with , information about available targets appears in the Process view.
Displaying the Services View
The Services tab provides a view of Oracle Solaris 10 and 11 Service Management Facility (SMF) services. The Oracle Solaris SMF feature defines the relationships between applications, or services, and is a method of managing them by providing a framework for startup scripts, init run levels, and configuration files. Each service is identified by a Fault Managed Resource Identifier (FMRI).
The Services tab contains SMF service instances, state, dependencies, and severity information. You can drill down to see specific service details, including the configuration, dependencies, and the processes that are in the service contract.
The following actions are available from the Services tab:
-
View a list of services currently installed and their states
-
View a list of dependencies and dependents for FMRI
-
View the relationship between services and processes
-
View details about why a service is not available
-
Obtain logs for debugging
-
Clear faults for FMRI
-
Invoke the disable, enable, and restart actions on FMRI
-
Read configuration files
Services information is available for agent managed and agentlessly managed Oracle Solaris 10 and 11 operating systems, including global and non-global zones.
Thresholds
The Thresholds tab contains information about all monitored attributes for the selected operating system, including per-instance attributes such as File System Usage for each file-system on the asset.
Displaying Thresholds
Procedure to display thresholds.
- Display the Analytics view.
- Click the Thresholds tab.
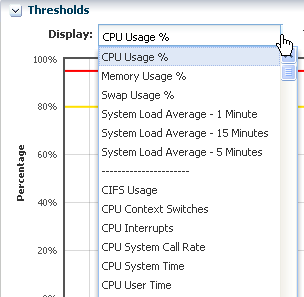
- Click the Display menu to show the available monitored attributes.
Figure 6-10 shows a partial list of the monitored attributes available for display.
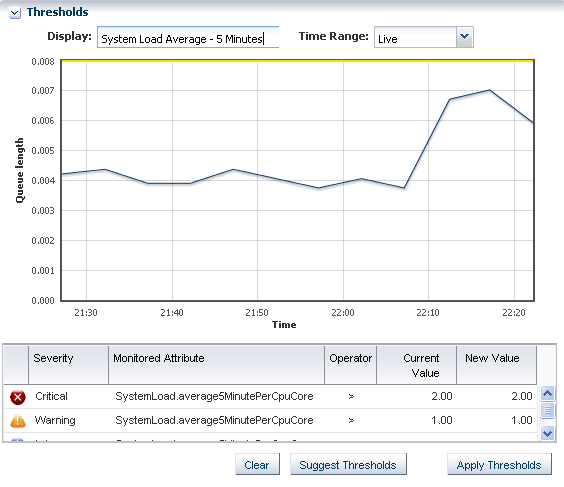
Charts for the historical data of those attributes show the alert monitor threshold levels, if configured, for that attribute. Figure 6-11 shows the chart for the System Load Average - 5 minutes. The time frame selected is Live. Under the chart are the severity levels for this monitored attribute (SystemLoad.average15MinutePerCpuCore), the operator, and the threshold values. Instead of editing the thresholds in the Monitoring tab, you change the values on this page. You can either add values in the New Value column or click Suggest Thresholds to populate the fields with suggested values. Click Apply Thresholds to change the existing thresholds.
Note:
When the threshold monitor is modified, the asset is removed from the default monitoring profile and a custom profile created.
Historical Data
The history chart displays the most applicable chart interval for the selected date and time.
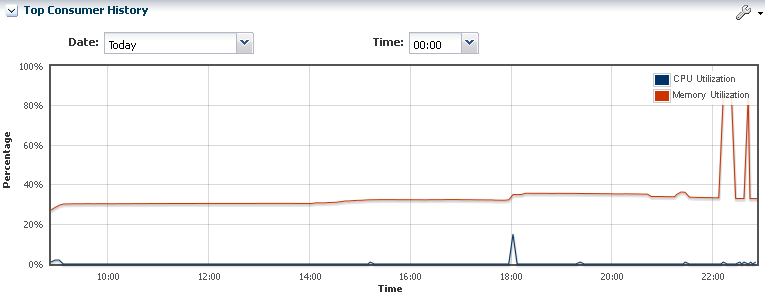
The History tab contains the history for the top consumers. By default, the current date displays. The time selection box is used to select a time of day for which the top consumer processes are listed. It does not affect the chart, which can only show discrete intervals of 1 hour, 1 day, 5 days, 3 weeks, 6 weeks, and 6 months. Figure 6-12 is an example of a Top Consumer History chart.
Metrics
The Metrics tab provides you with specific details about various operating system statistics, such as the percentage of memory used, and view graphs.
When monitoring thresholds are enabled for an element, you can reset the thresholds. When an element does not have a monitoring threshold, you can configure a new monitoring threshold.
Displaying Metrics
Procedure to display metrics.
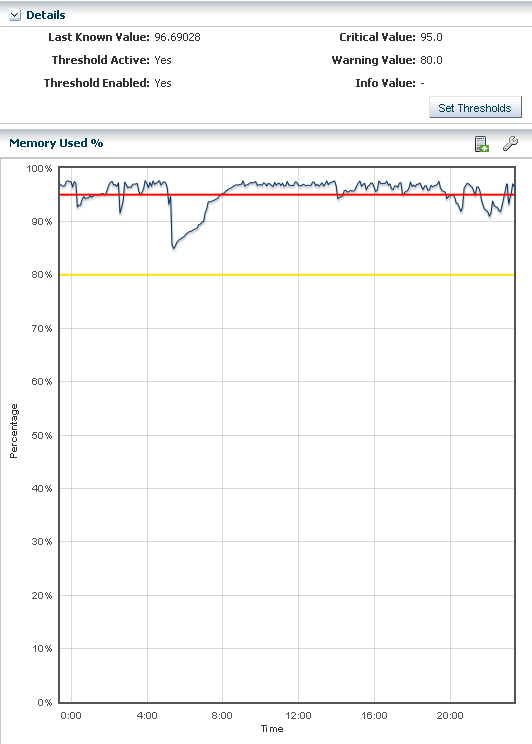
The type of resource determines the available details. Figure 6-14 is an example of the details and graph for the Memory Used % element. This example shows a system in trouble. The Details shows the last known value memory usage at 95.59111 percent and the established monitoring parameters. A warning incident is generated at 80 percent and a critical incident is generated when the used memory reaches 95 percent.
View the bar graph to see how the memory usage has trended over the selected time period. The yellow and red horizontal lines indicate the warning and critical thresholds.
Figure 6-14 Memory Used % Details and Graph
Description of "Figure 6-14 Memory Used % Details and Graph"
The wrench icon appears above the graph. For this graph, you can click the icon to change the graph style to line, bar, or area. You can also change the definition of the X axis from 1 day to 1 hour, 5 days, 3 weeks, 6 weeks, or 6 months. The export icon enables you to export the graph to file in CSV or XML format.
You have the opportunity to reset the threshold values for the monitoring rule from this page, or to view recommended threshold values based on past performance. When you click the Set Thresholds button, you are taken to the Thresholds tab, where you can enter new threshold values. When the Thresholds tab appears, the drop-down menu contains the name of the monitored attribute from the metrics view, and the associated chart appears. Editing a threshold value creates a custom set of monitoring rules for the asset. See <Chapter 4, "Monitoring Rules and Policies"> for more information about editing individual monitoring rule parameters and creating a custom monitoring policy.
Displaying and Creating Charts
You can modify and change the type of charts.
The Charts tab enables you to modify the following charts to change the type of chart and to see utilization data over longer periods of time, up to six months:
-
Power Utilization: Servers, chassis
-
CPU Utilization: Operating system, operating system for a virtualization host, virtual host, server pool
-
Memory Utilization: Operating system, virtual host, server pool
-
Network Utilization: Operating system, operating system for a virtual machine, virtualization host, server pool
-
File System Utilization: Oracle Solaris OS and Linux OS
-
System Load: Oracle Solaris OS and Linux OS
For the first five days of operation, Oracle Enterprise Manager Ops Center collects data every five minutes. After the fifth day, the reported data is an average, according to the following:
-
Five days to three weeks: Average for each hour
-
Three weeks to six weeks: Average for each 12-hour period
-
Six weeks to six months: Average for each 24-hour period
Oracle Enterprise Manager Ops Center deletes the data after six months.
Display Charts
Procedure to display charts.
- Display the Analytics view.
- Click the Charts tab.
You can create charts 24 hours after you first manage the asset. The asset must be operating and the Enterprise Controller must be able to get access to the asset. You can use the default format or change the charts to use a line, bar, or area format or to use different time intervals.
Create Charts
Procedure to create charts.
- Display the Analytics view.
- Click the Charts tab.
- Select an option from the Chart type menu to display the output as a line, bar, or area chart.
- Select Live, 1 Hour, 1 Day, 5 Days, 3 Weeks, 6 Weeks, or 6 Months from the X Axis (Time) menu to change the time frame for the data.
- Select Percentage or Unit of Measure to configure the chart's Y Axis.
- Select the component and options to plot from the Plot selection.
By default, the graphs show one day of data. Select Live in the X Axis menu to change to Live mode, which reports new information every 5 seconds. You can also change the graph to one of the following periods:
-
One hour (1H): One point for every 5 minutes
-
One day (1D): One point for every 5 minutes
-
Five days (5D): One point for every 5 minutes
-
Three weeks (3W): One point every hour
-
Six weeks (6W): One point every 12 hours
-
Six months (6M): One point for every day. To make a graph with the minimum of two points, a system must have been managed for at least 10 minutes to view a one-hour graph and for at least two days to view the six-months graph.
The software stores the data for these time periods separately. For example, when a server is managed for two hours and you select the 6W view, the graph does not display because only one point of data of that type is available; the second point has not yet occurred. When you select the 1D view, the graph displays 24 points of data (120 minutes in 5-minute intervals). However, the graph displays these points over a 24-hour period and not over the actual two-hour period. For the most accurate representation of the data, choose a time period that is less than or equal to the time that the selected server has been managed.
You can export the data for either the current view or all available data to a file in either CSV or XML format. Click Export Chart Data to choose options for exporting the data.
When the graph is blank for a server, one of the following conditions has occurred:
-
Server does not have the appropriate ILOM version.
-
Server has not been discovered through the ILOM driver.
-
Server is unreachable.
Displaying Virtualization Analytics
The Virtualization Analytics view displays resource usage of the physical server for each running operating system instance, showing the physical resources consumed by the control domain (global zone or Oracle VM Server), and each non-global zone or guest.
Metrics for Oracle VM Server for x86 are available through the Oracle VM Manager.
-
Virtualization Analytics Summary
-
Virtualization Analytics Zones or Virtualization Analytics Guests
-
Virtualization Analytics History
The information is refreshed every 20 seconds for a guest running on a virtualization server container, including global zones, Oracle VM Server for SPARC, and Oracle VM Server for x86.
Customizing the Analytics View
The default display is the resource usage data. You can change the display settings for each view and choose which system resource graphs and details to display. The changes made on a given analytics page affects the views of all analytics screens for the same OS or virtualized OS.
Customize the Analytics View
Procedure to customize the analytics view.
- Select an operating system (global zone) or zone in the Navigation pane.
- Click the Analytics tab.
- Click the Settings Menu icon in the center pane.
- If you select a global zone that has zone, click the Zones Analytics subtab, then click the Settings Menu icon in the center pane to change the view for the Zones Analytics page.
