Oracle® Enterprise Manager Ops Center
Understanding Operating System Performance and Capacity
12c Release 3 (12.3.0.0.0)
E60025-01
June 2015
This guide provides an overview of the OS Analytics feature of Oracle Enterprise Manager Ops Center.
Introduction to Operating System Performance and Capacity
Optimizing your operating system (OS) environment can improve system performance and capacity by helping you to quickly identify areas of concern. The monitoring feature in Oracle Enterprise Manager Ops Center provides extensive information about your monitored operating systems and zones. You can use the information to evaluate performance, identify potential issues, and perform tuning.
The OS monitoring and analytics features give you quick and easy access to historical and real-time performance, process, and status details. Analytics is available for Oracle Solaris, Linux, and for the different types of OS virtualization that Oracle Enterprise Manager Ops Center supports, including Oracle Solaris Zones, Oracle VM Server for SPARC and Oracle VM Server for x86 guests.
The following are some details gathered on the performance and capacity of a specific operating system or zone:
-
Real time network details
-
Real time I/O details
-
Real time and historical process details
-
Real time and historical memory details
A number of charts provide a visual representation of performance and usage. Depending on the OS, the Summary tab contains charts for the consumers of system resources. The Charts tab lets you choose the type of chart, define the X-axis and Y-axis, and determine what you want to plot. All timed charts are all in GMT.
This document shows how you can use the Analytics feature to view the memory utilization, SMF status, and zone capacity on an Oracle Solaris 11 operating system.
See Related Articles and Resources for links to related information and articles.
What You Will Need
You need the following to view Analytics metrics for this example:
-
At least one agent-managed operating system. To view OS Analytics on an Oracle Solaris 11 operation system, the Enterprise Controller and Proxy Controller must be installed on an Oracle Solaris 11 OS.
-
At least one Oracle Solaris non-global zone to view zone analytics.
-
An Asset Administration role assigned to a group containing the operating systems.
Understanding Operating System Performance and Capacity
Analytics is available for Oracle Solaris, Linux, Oracle Solaris Zones, Oracle VM Server for SPARC and Oracle VM Server for x86 guests. This example shows the following:
-
Where to Find Analytics: Where to locate analytics information in the user interface.
-
Operating System Performance and Capacity: View a history of the top consumers. From the top consumers, you can quickly assess the memory utilization of an operating system and drill down to the process level for detailed information and view a load metric.
-
Oracle Solaris SMF Services: View the SMF status of an Oracle Solaris 11 operating system and quickly identify a critical issue.
-
Virtualization Performance and Capacity: Monitor performance and capacity information for your Oracle Solaris zones. Drill down to the process level for detailed information.
Where to Find Analytics
Analytics is available for Oracle Solaris, Linux, and Oracle Solaris Zones. Select an operating system from the Assets. The level of detail depends on the type of OS and whether the OS is agent-managed or not. Because an Agent Controller is required to capture the level of system activity and individual process activity, the greatest level of detail is available for agent-managed operating systems.
-
Select an operating system from the Assets section in the Navigation pane.
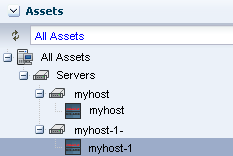
Description of the illustration assets.png
-
Click the Analytics tab in the center pane.
-
When you select an OS without zone capabilities, a single layer of subtabs is available.

Description of the illustration analytics_tab.png
-
When you select an OS with a global zone, two layers of sub-tabs are available. The first layer under Analytics is OS Analytics and Zone Analytics. Each of these tabs has a set of tabs.

Description of the illustration analytics_2tab.png
Operating System Performance and Capacity
You can quickly see the top consumers are for a specific operating system, drill down for more detailed information, or view the trend.
Top Consumers for CPU, Memory, Network, and I/O utilization appear on the Summary page. Each performance metric is charted to show the status at a glance. The table to the right of each graph lists the top five processes that are consuming resources. You can click the View icon next to a process to drill down to the process level and view specific areas of concern. This example shows extremely high memory utilization on a selected OS and where you can get more information.
-
Select an operating system from the Assets section in the Navigation pane.
-
Click the Analytics tab.
The left side of the page has four graphs, one for each type of performance metric. The right side of the page has the corresponding list of top consumers. In this example, Memory Utilization is at 96.5%.
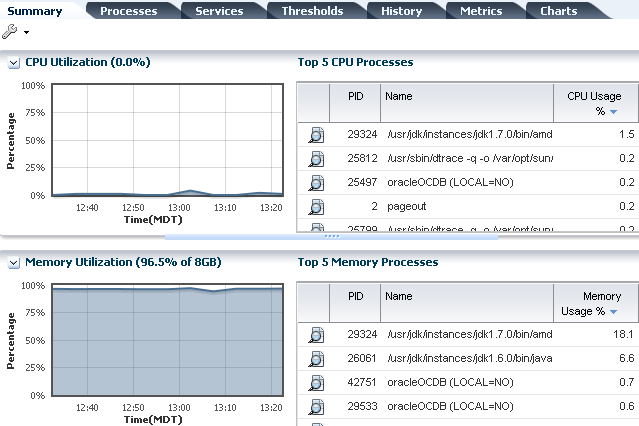
Description of the illustration top_consumers.png
-
Click the History tab to see the trend. Select the date from the drop-down list to show a running history. The history shows that the memory is consistently at close to 100% and CPU utilization has high spikes on a consistent basis.
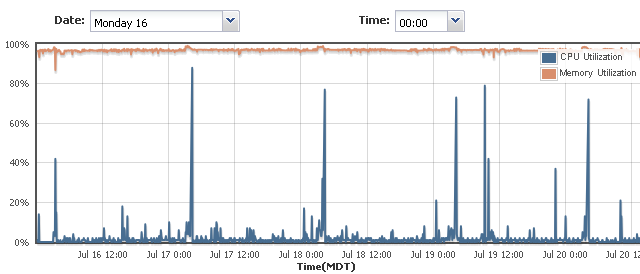
Description of the illustration top_consumer_5day.png
-
Hover over the line on the graph to display the timestamp and percentage. In this screen capture, the CPU Utilization on July 17 at 4:15 was 88.0%.
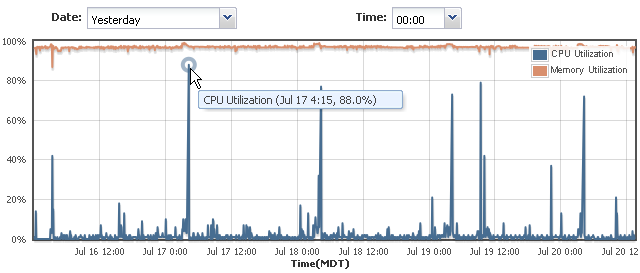
Description of the illustration top_consumer_cpu_spike.png
-
Click the Processes tab to see all processes, the state, and usage. Click a table heading to sort the table in ascending or descending order. In this example, the sort is by Memory Usage. Highlight a process, then click the View icon to drill down for process details.

Description of the illustration memory_usage.png
-
The Process Details page includes a Summary, Process Details, Thread Information, Handles, Process Environment, and Memory Information. Expand the area you want to view, in this case Memory Information. You can sort columns. Click Kill Process to force the process to quit. You can also perform this action on the main Process page, as described in Step 7.
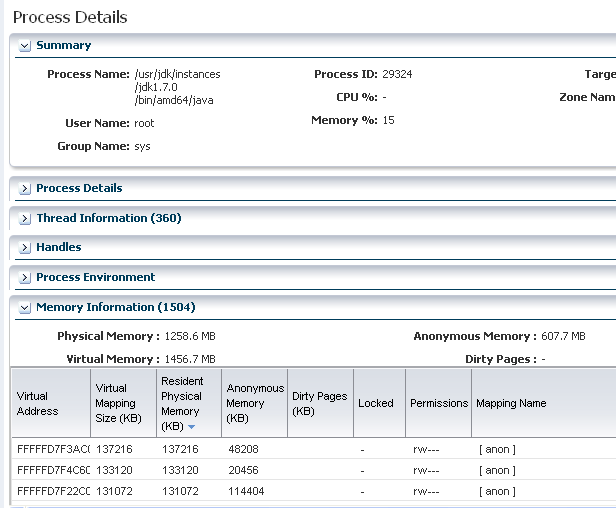
Description of the illustration process_details.png
-
After you review the process, you can stop the process or close the window and review another high consumer process. To stop the process or force the process to quit, select a process and click the Kill Process icon. A pop-up box prompts for confirmation and a check box offers the option to force the process to quit. Click Kill Process to confirm.
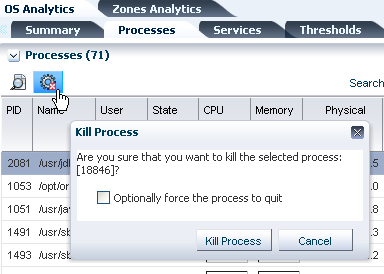
Description of the illustration kill_process.png
Operating System Metrics
With Metrics, you can view monitoring details on the components of an operating system, such as load, file system, networks, kernel memory, and users.
-
Click the Metrics tab.
-
Click a component to view the available elements. In this example, click Load to see an overview of all load metrics.

Description of the illustration metric_load.png
-
Expand the component and click an element to view the details and a chart. In this example, the Load component is expanded and the elements Used Memory Percentage and Free Memory Percentage are shown.
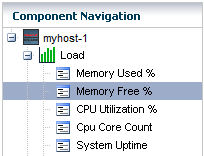
Description of the illustration os_metrics_expand.png
Oracle Solaris SMF Services
Service Management Facility (SMF) is a feature of the Oracle Solaris operating system. Beginning with Oracle Solaris 10, SMF services provide a set of capabilities to other software, local services, remote services, and system entities that include ISV applications. A milestone is a special type of service that defines the level of readiness for a system or for a group of services.
Each SMF service has the potential to have several instances. An instance is a specific configuration of a service. For example, a web server is an SMF service, while a web server daemon configured to listen on a specific port is an instance. Each instance of the web server service might have different configuration requirements. The service has system-wide configuration requirements, but each instance can override specific requirements, as needed. Multiple instances of a single service are managed as children of the service.
To work properly, many services depend on a list of local services. For example, the Sendmail service depends on the Naming service, which depends on Networking services. If an underlying service fails, you must correct it before dependent services are affected or to restore dependent services.
SMF services have the following states:
-
Online: The service instance is enabled and has successfully started.
-
Disabled: The service instance is not enabled and is not running.
-
Maintenance: The service instance has encountered an error that must be resolved by the administrator.
-
Offline: The service instance is enabled, but the service is not yet running or available to run.
-
Degraded: The service instance is enabled, but is running at a limited capacity.
-
Uninitialized: This is the initial state for all services before their configuration is read.
-
Legacy: The service is not managed by SMF, but you can view the service. This state is only used by legacy services.
Oracle Enterprise Manager Ops Center enables you to view the state of SMF services for a particular operating system. You can view all states, or filter for a particular state. You can view the service details and the associated Fault Managed Resource Identifier (FMRI).
This example shows that there is a critical issue with an SMF service and how to drill down to identify the problem.
-
Expand Assets in the Navigation pane, then select an operating system.
-
Click the Analytics tab in the center pane, then click the Services subtab.
-
The default view is all states. Click the drop-down to filter for a specific state.
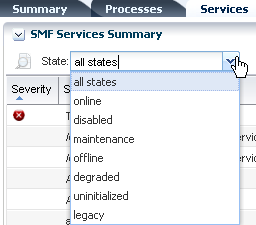
Description of the illustration service_states.png
-
In this example, there is a critical issue with the Timezone Reload service. The critical issue appears in the first row of the table.

Description of the illustration services-all.png
-
Double-click a service name to view details. In this case, the Timezone Reload service is in maintenance mode and a critical alert is associated with the service.
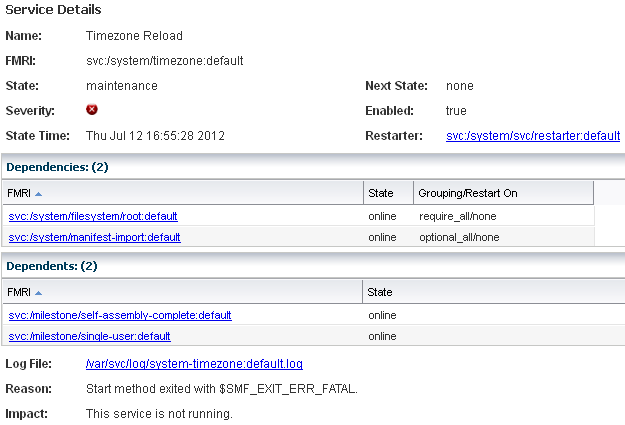
Description of the illustration service_details.png
The top section of the service details includes the name, FMRI, state, severity, when the date and time when the state was reached, the next state, whether the service is enabled, and a link to the restarter. Two tables appear below the details. The first, titled Dependencies, shows the number of dependencies, the FMRI, state, and Grouping or restart location. The second table, titled Dependents, shows the number of services depending on the service, the FMRI, and the state. The bottom of the page includes a link to the log file, the reason for the issue, and the impact.
-
To drill down and view the service details about a dependency or dependent service, and to access log files, click the link in the FMRI column.
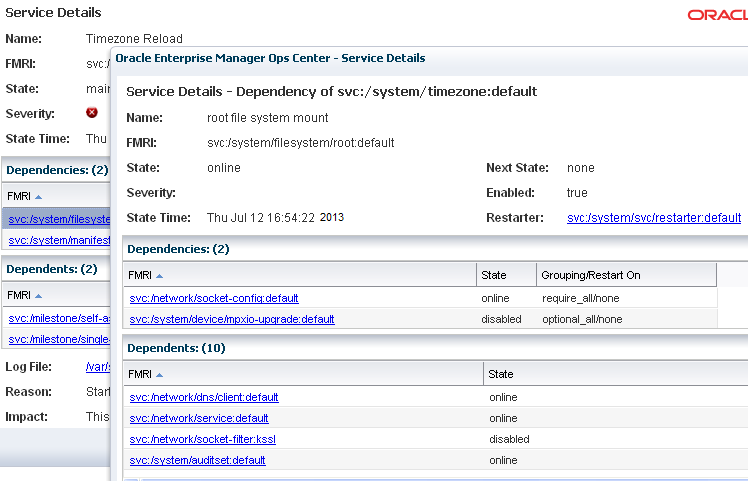
Description of the illustration service_detail_dependency.png
-
To view the contents of a log file, click the link. In this example, the file content of the log file indicates that the issue is caused by a missing file or directory and cannot link from
/usr/share/lib/zoneinfo/GMT-7to/etc/localtime.
Description of the illustration service_logfile_content.png
The logs enable you to quickly identify the impact to other services and to identify and correct the issue.
Virtualization Performance and Capacity
Zones Analytics gives you several different views of zone performance and capacity. Charts and top consumer tables show the capacity and the percentage used by the global zone and all associated non-global zones.
The tabs provide different views of the resources allocated to each zone and the CPU and memory utilization. The Resource Pool Utilization page provides information for both shared and dedicated CPU.
-
Expand Assets in the Navigation pane, then select an operating system.
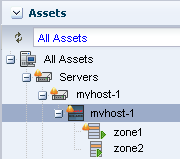
Description of the illustration select_os.png
-
Click the Analytics tab in the center pane, then click the Zone Analytics sub-tab.

Description of the illustration analytics_2tab.png
-
The Zone Analytics Summary page provides a graphical representation of the top five consumers for CPU utilization and memory utilization. The corresponding table on the right lists the guest name and usage.
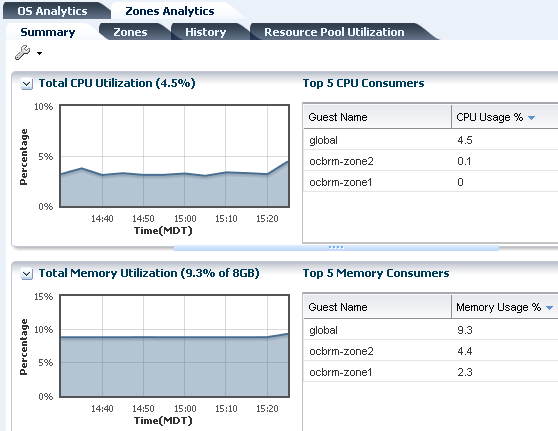
Description of the illustration zone_summary.png
-
Click the Zones tab to view the CPU usage and memory allocation for the global zone and all associated non-global zones.

Description of the illustration zones.png
-
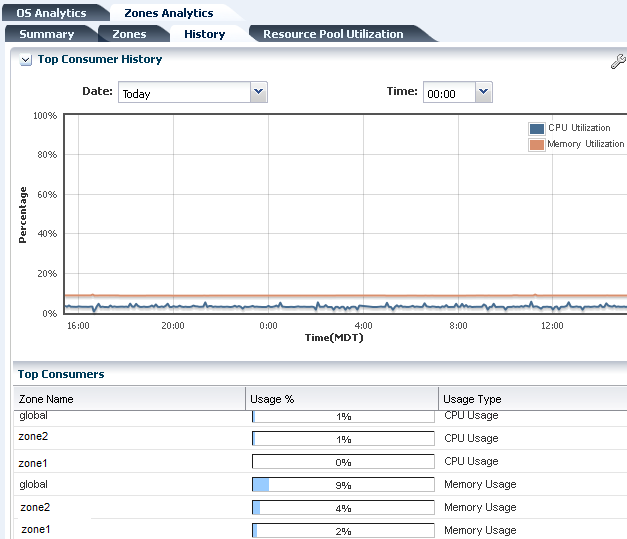
Click the History tab to view a graphical representation of the percentage of CPU and memory over time that the top consumers used. You can edit the chart by selecting a date and time to graph. The lower portion of the page has a Top Consumers table that lists the zone name, Usage percentage, and whether the usage type is CPU Usage or Memory Usage.
Description of the illustration zone_history.png
-
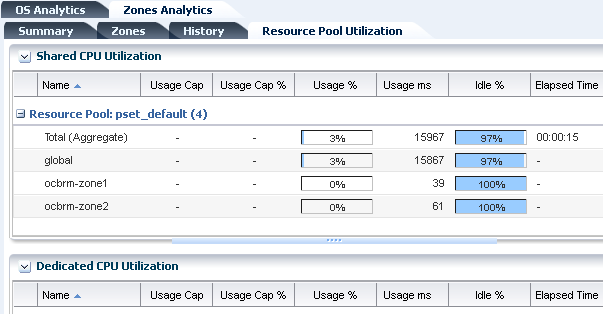
Click the Resource Pool Utilization tab to see CPU allocation and utilization across the zones when the zones are a member of a server pool. This page shows greater details on how the CPU is allocated for the global and non-global zones, and the aggregated total capacity and usage.
Description of the illustration zone_cpu_util.png
What's Next?
Use the Analytics information to monitor processes and drill down to greater process details. You can use the information to tune your monitoring policies and rules and alerting thresholds to optimize the performance and capacity in your data center.
Related Articles and Resources
For more information, see the Oracle Enterprise Manager Ops Center Documentation Library at http://docs.oracle.com/cd/E59957_01/index.htm.
The following chapters in the Oracle Enterprise Manager Configure Reference and Oracle Enterprise Manager Operate Reference contain more information:
For end-to-end examples, see the workflows and how to documentation in the library. For deployment tasks, go to http://docs.oracle.com/cd/E59957_01/nav/deploy.htm and for operate tasks go to http://docs.oracle.com/cd/E59957_01/nav/operate.htm.
For in-depth information about Oracle Solaris 11, see the Oracle Solaris 11 documentation at http://docs.oracle.com/cd/E23824_01/index.html.
Documentation Accessibility
For information about Oracle's commitment to accessibility, visit the Oracle Accessibility Program website at http://www.oracle.com/pls/topic/lookup?ctx=acc&id=docacc.
Oracle customers that have purchased support have access to electronic support through My Oracle Support. For information, visit http://www.oracle.com/pls/topic/lookup?ctx=acc&id=info or visit http://www.oracle.com/pls/topic/lookup?ctx=acc&id=trs if you are hearing impaired.
Oracle Enterprise Manager Ops Center Understanding Operating System Performance and Capacity, 12c Release 3 (12.3.0.0.0)
E60025-01
Copyright © 2007, 2015, Oracle and/or its affiliates. All rights reserved.
This software and related documentation are provided under a license agreement containing restrictions on use and disclosure and are protected by intellectual property laws. Except as expressly permitted in your license agreement or allowed by law, you may not use, copy, reproduce, translate, broadcast, modify, license, transmit, distribute, exhibit, perform, publish, or display any part, in any form, or by any means. Reverse engineering, disassembly, or decompilation of this software, unless required by law for interoperability, is prohibited.
The information contained herein is subject to change without notice and is not warranted to be error-free. If you find any errors, please report them to us in writing.
If this is software or related documentation that is delivered to the U.S. Government or anyone licensing it on behalf of the U.S. Government, then the following notice is applicable:
U.S. GOVERNMENT END USERS: Oracle programs, including any operating system, integrated software, any programs installed on the hardware, and/or documentation, delivered to U.S. Government end users are "commercial computer software" pursuant to the applicable Federal Acquisition Regulation and agency-specific supplemental regulations. As such, use, duplication, disclosure, modification, and adaptation of the programs, including any operating system, integrated software, any programs installed on the hardware, and/or documentation, shall be subject to license terms and license restrictions applicable to the programs. No other rights are granted to the U.S. Government.
This software or hardware is developed for general use in a variety of information management applications. It is not developed or intended for use in any inherently dangerous applications, including applications that may create a risk of personal injury. If you use this software or hardware in dangerous applications, then you shall be responsible to take all appropriate fail-safe, backup, redundancy, and other measures to ensure its safe use. Oracle Corporation and its affiliates disclaim any liability for any damages caused by use of this software or hardware in dangerous applications.
Oracle and Java are registered trademarks of Oracle and/or its affiliates. Other names may be trademarks of their respective owners.
Intel and Intel Xeon are trademarks or registered trademarks of Intel Corporation. All SPARC trademarks are used under license and are trademarks or registered trademarks of SPARC International, Inc. AMD, Opteron, the AMD logo, and the AMD Opteron logo are trademarks or registered trademarks of Advanced Micro Devices. UNIX is a registered trademark of The Open Group.
This software or hardware and documentation may provide access to or information about content, products, and services from third parties. Oracle Corporation and its affiliates are not responsible for and expressly disclaim all warranties of any kind with respect to third-party content, products, and services unless otherwise set forth in an applicable agreement between you and Oracle. Oracle Corporation and its affiliates will not be responsible for any loss, costs, or damages incurred due to your access to or use of third-party content, products, or services, except as set forth in an applicable agreement between you and Oracle.