Log entry information
This topic describes some of the information that is found in log entries.
For Dgraph Gateways in cluster-mode, this logged information can help you trace the life cycle of requests.
OES followed by the number and text of the message, as in this example:
OES-000135: Endeca Server has successfully initialized
Logging levels
| ODL Log Level | Meaning |
|---|---|
INCIDENT_ERROR |
Indicates a serious problem that may be caused by a bug in the product and that should be reported to Oracle Support. In general, these messages describe events that are of considerable importance and which will prevent normal program execution. |
ERROR |
Indicates a serious problem that requires immediate attention from the administrator and is not caused by a bug in the product. |
WARNING |
Indicates a potential problem that should be reviewed by the administrator. |
NOTIFICATION |
A message level for informational messages. This level typically indicates a major lifecycle event such as the activation or deactivation of a primary sub-component or feature. This is the default level. |
TRACE |
Debug information for events that are meaningful to administrators, such as public API entry or exit points. |
These levels allow you to monitor events of interest at the appropriate granularity without being overwhelmed by messages that are not relevant. When you are initially setting up your application in a development environment, you might want to use the NOTIFICATION level to get most of the messages, and change to a less verbose level in production.
Logged request type and content
When a new request arrives at the server, the SOAP message in the request is analyzed. From the SOAP body, the request type of each request (such as allocateBulkLoadPort) is determined and logged. Complex requests (like Conversation) will be analyzed further, and detailed information will be logged as needed. Note that this information is logged if the log level is DEBUG.
Conversation request is sent to Server1. After being updated, the logs on the server might have entries such as these:
OES-000239: Receive request 512498665 of type 'Conversation'. This request does the
   following queries: [RecordCount, RecordList]
OES-000002: Timing event: start 512498665 ...
OES-000002: Timing event: DGraph start 512498665 ...
OES-000002: Timing event: DGraph end 512498665 ...
OES-000002: Timing event: end 512498665 ...
As shown in the example, when Server1 receives a request, it will choose a node from the routing table and tunnel the request to that node. The routed request will be processed on that node. In the Dgraph request log, the request can also be tracked via the request ID in the HTTP header.
Log ingest timestamp and result
For ingest operations, a start and end timestamp is logged. At the end of the operation, the ingest results are also logged (number of added records, number of deleted records, number of updated records, number of replaced records, number of added or updated records).
OES-000002: Timing event: start ingest into Dgraph "http://host:7010"
OES-000002: Timing event: end ingest into Dgraph "http://host:7010" (1 added, 1 deleted, 0 replaced, 0 updated, 0 added or updated)
Total request and Dgraph processing times
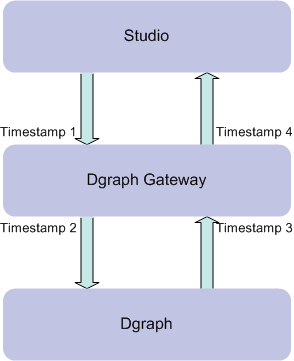
Four calculated timestamps in the logs record the time points of a query as it moves from Studio to the Dgraph and back. The query path is shown in this illustration:

- Timestamp1: Dgraph Gateway begins to process the request from Studio
- Timestamp2: Dgraph Gateway forwards the request to the Dgraph
- Timestamp3: Dgraph Gateway receives the response from the Dgraph
- Timestamp4: Dgraph Gateway finishes processing the request
- (Timestamp4 - Timestamp1) is the total request processing time in Dgraph Gateway.
- (Timestamp3 - Timestamp2) is the Dgraph processing time.
OES-000240: Total time cost(Request processing) of request 512498665 : 1717 ms
OES-000240: Total time cost(Dgraph processing) of request 512498665 : 424 ms