Using the System Usage page
On the System Usage page, you use the fields at the top to set the date range for the report data. You can also change the displayed data on individual reports.
- To set the date range for the displayed data on all of the reports, you can either set a time frame from the current day, or a specific range of dates.
By default, the page is set to display data from the last 30 days.

- To select a different time frame, from the list, select the time frame to use.
- To select a specific range of dates, click the other radio button, then in the From and To date fields, provide the start and end dates.
- After selecting a time frame or range of dates, to update the reports to reflect the new selection, click Update Report.
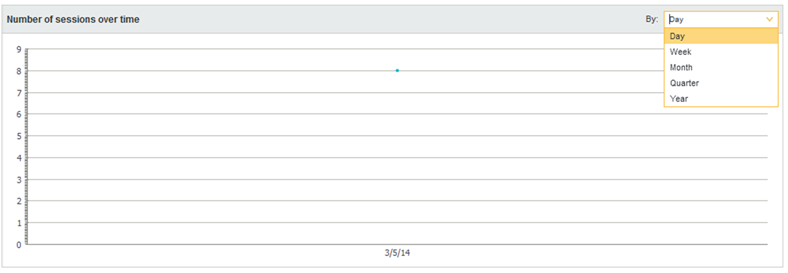
- For the Number of sessions over time report, you can control the date/time unit used to display the results.
To change the date/time unit, select the new unit from the list.

The report is updated automatically to use the new value.
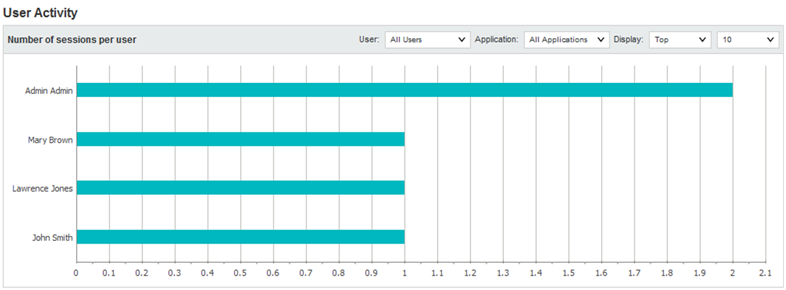
- By default, the User Activity report shows the top 10 number of sessions per user for all projects during the selected time period.

You can narrow the report to show values for a specific user or project, and change the number of values displayed.
- To narrow the report to a specific user, from the User list, select the user.
The report is updated to display the top or bottom number of sessions for projects the user has used.
- To narrow the report to a specific project, from the Project list, select the project.
The report is updated to show the users with the top or bottom number of sessions for users.
If you select both a specific project and a specific user, the report displays a single bar showing the number of sessions for that user and project.
- Use the Display settings to control the number of values to display and whether to display the top or bottom values.
- To narrow the report to a specific user, from the User list, select the user.
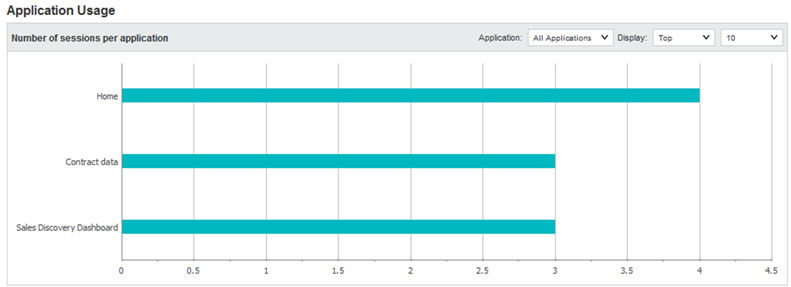
- By default, the Project Usage report shows the 10 projects with the most sessions for the selected time range.

You can narrow the report to show values for a specific project, and change the number of values displayed.
- To narrow the report to a specific project, from the Project list, select the project.
The report is changed to a line chart showing the number of sessions per day for the selected project.
A date unit list is added to allow you to select the unit to use.

For example, you can display the number of sessions per day, per week, or per month.
- If you are displaying the number of sessions for all projects, use the Display settings to control the number of values to display and whether to display the top or bottom values.
- To narrow the report to a specific project, from the Project list, select the project.