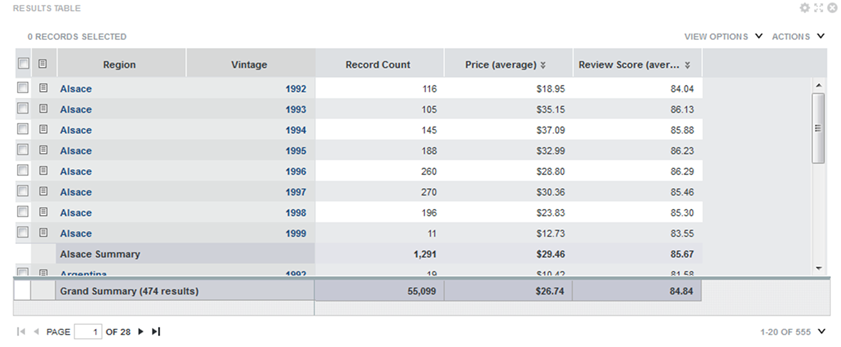
About the Results Table layout
A Results Table always contains a set of persistent columns, and can also contain one or more column sets.
- For a record list, any column can be a persistent column. One use of persistent columns in a record list might be to display identifying information for each record, such as an ID or name.
- For aggregated tables, the persistent columns always contain the dimension values used to aggregate the metric values.
For example, the table could have persistent columns for the Country and Product Line dimensions. The values in the other columns are then aggregated by the country and product line values.
For an aggregated table, the persistent columns are by default locked to the left of the table, and do not scroll horizontally with the other columns. For a record list, the persistent columns are unlocked by default.
The columns for the currently selected column set display after the persistent columns. For aggregated tables, the columns contain the aggregated metric values. To define column sets, see Creating column sets.
Aggregated tables can also contain summary rows. There can be summary rows to aggregate values across a dimension value, as well as a summary row that aggregates the values across the entire table. The same aggregation method is used for a metric throughout the table.

You can page through and sort results. You may be able to select the columns to display, and use displayed values to refine the data or display related content.