Refining Parallel Coordinates Plot data

You can select metric values in a Parallel Coordinates Plot to refine the displayed data.

You can either:
  • Use the legend or plotted lines to select individual dimension values.
  • Refine the dimension to only include values associated with a specific range of metric values.

    For example, you can refine the Model attribute to only include models for which the average price is between $15,000 and $20,000.

To refine the data displayed in a Parallel Coordinates Plot:
  1. To refine by a specific dimension value, do one of the following:
    • In the chart legend, click a dimension value.
    • On the chart, click the line plotted for a dimension value

    You can also use Ctrl-click to select multiple individual values.

  2. To refine by dimension values that are within a range of metric values:
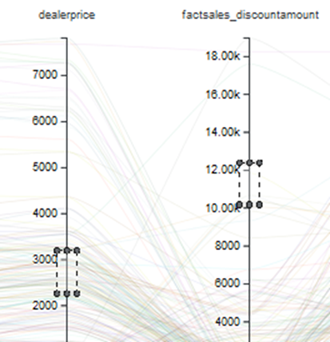
    1. Use the mouse to select a range of values on a metric axis.

      You can create multiple selected areas on different axes.


      Excerpt of a Parallel Coordinates plot showing selected areas on two of the axes

      To clear the selected areas, click the Clear selections link above the chart legend.

    2. Click any of the selected areas.

    The dimension values for all lines that run through the selected ranges are added to the Selected Refinements panel.