Adding dimensions and metrics to the Pivot Table

Each Pivot Table consists of dimension rows and columns to determine the aggregation, and metrics to determine the displayed values.

At the right of the Table Layout tab is a mockup of the Pivot Table format, with drop zones to add dimensions to the row and column groups, and to add metrics. A placeholder block indicates whether the metrics are displayed as columns or rows.
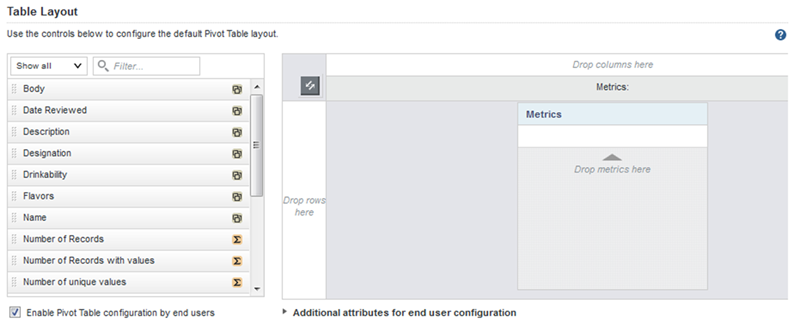

Table layout tab of the Pivot Table edit view with no metrics or dimensions selected

To populate the default view of the Pivot Table:
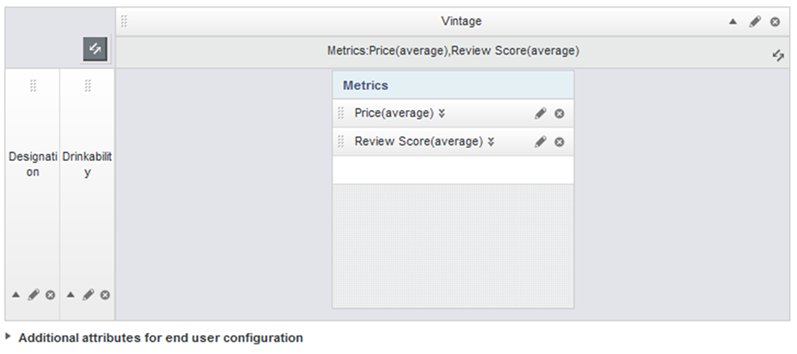
  1. To add a dimension to a row or column group, drag the dimension from the list to either the row or column group drop zone.

    You must add at least one dimension to the row group zone.

    If there are existing row or column dimensions, you can drop the new dimension before or after those dimensions.

    You can also drag and drop the dimensions within the mockup to change the order of the row and column groups.

  2. To add a metric to the Pivot Table, drag the metric from the list to the metric drop zone.

    The order of the metrics in the list determines the order (from left to right for columns or top to bottom for rows) of the metrics in the Pivot Table. The placeholder also lists the selected metrics.


    Table layout tab of the Pivot Table edit view with metrics and dimensions selected