Viewing the global report dashboard
The Salesforce Integration Reporting Dashboard provides an overview of action, import, and export activity over the last seven days. In this report, the volume of data flowing between Oracle Eloqua and Salesforce Integration app is shown per day, including created, updated, and failed records. The report initially displays the most recent seven days of data, with an option to select a specific seven day interval. Click on the Failed portion of one of the bar's to drill down to a daily report.

The global report dashboard is located on the Status and Reporting tab in the Salesforce Integration app. Data is retained for a period of three months.
To view the global report dashboard:
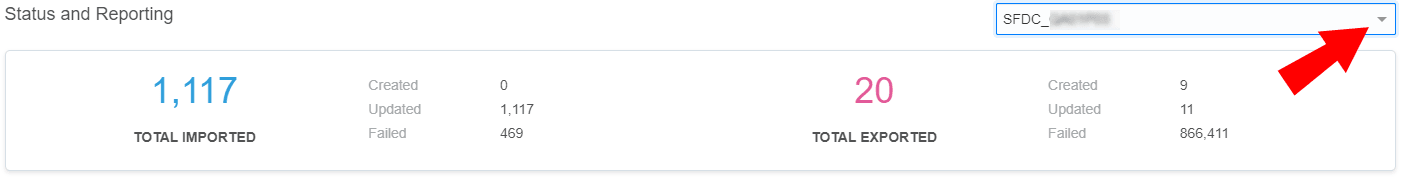
- In the Salesforce Integration app, click the Status and Reporting tab. The dashboard is displayed.
- From the connection list, select the connection for which you want to display a dashboard. An overview of the total amount of imports and exports over the current seven day period that were created, updated, or failed are displayed.
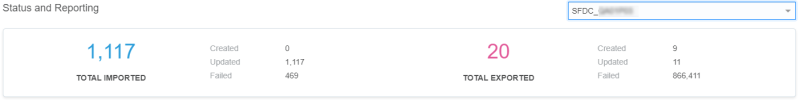

You can view the amount of records created, updated, or failed over a seven day period with an option to view the details for each specific day by mousing over the day. Here, you can view reports for a specific seven day period in the past.
Viewing connection errors
The Status and Reporting screen displays errors associated with a current connection. If you have multiple active connections, and a hidden connection reported an error, the Salesforce Integration app will display a notification message at the top of the Status and Reporting screen. To find out which hidden connections have errors, open the connection drop-down.
Connections that have errors will have a warning icon  beside them.
Viewing imports and exports by target
Import data is categorized and displayed in a pie chart to help visually identify how many records are being imported into Oracle Eloqua from Salesforce by target.

The Exports by Target bar chart displays all records within the period so you can view how many records were created or updated from Oracle Eloqua to Salesforce, categorized by target.
