Closed-loop reporting dashboard
Closed-loop reporting allows you to attribute sales opportunity revenue to marketing campaigns so that you can analyze your overall campaign revenue performance (ROI), and identify the best and worst performing campaigns.
To implement closed-loop reporting with Oracle Eloqua, there are several configuration tasks that you must complete in both your CRM and Oracle Eloqua. After implementation, you can use closed-loop dashboards and Insight reports to demonstrate real ROI and revenue impact from your marking campaigns. Learn more about closed-loop reporting and configuring opportunity settings.
Click a link below to find out more about this dashboard:
Good to know
- Closed-loop reporting must be implemented in order to use this dashboard. Learn more about closed-loop reporting.
- The dashboard includes campaigns that were active during the time frame that you specify. Campaigns are associated to an opportunity based on campaign response rule settings.
- Campaign responses are recorded only after the campaign's reporting start date. This date might not be the same as the activation date.
- To access a dashboard report in Insight, click
 . The dashboard reports are available in Insight in the following location: Shared Folders / Dashboard Reports / Closed-Loop Reporting.
Dashboard filters
Use the Filter results section to filter your campaigns. The following filters are available:
- Date Range: The time frame used to determine what campaigns are included on the dashboard. To appear on the dashboard, the campaign must be active during this time frame.
- Campaign Options: Groups the data on the dashboard by Campaign Type, Product, or Region. If a campaign does not have this information, it is classified as Unknown.
Dashboard metrics
| Metric | Description |
|---|---|
| Attributed Revenue | The total revenue attributed to a campaign |
| Influenced Revenue | The total revenue of an opportunity, which is evenly distributed to all the campaigns associated with that opportunity |
| Attributed Revenue Lost | The total revenue attributed to a campaign for all opportunities with a Closed/Lost status |
| Attributed Revenue Open | The total revenue attributed to a campaign for all opportunities with an open status |
| Attributed Revenue Won | The total revenue attributed to a campaign for all opportunities with an Closed Won status |
| Percent of Total (Lost) | Total Attributed Opportunities Lost / (Total Attributed Opportunities Lost + Total Attributed Opportunities Open + Total Attributed Opportunities Won) |
| Percent of Total (Open) | Total Attributed Opportunities Open / (Total Attributed Opportunities Lost + Total Attributed Opportunities Open + Total Attributed Opportunities Won) |
| Percent of Total (Won) | Total Attributed Opportunities Won / (Total Attributed Opportunities Lost + Total Attributed Opportunities Open + Total Attributed Opportunities Won) |
| Total Influenced Opportunities Won | The total count of Closed Won opportunities attributed to a campaign or campaigns |
| Total Attributed Opportunities Won | The total count of Closed Won opportunities attributed to a campaign or campaigns |
| Attributed ROI | The sum of the actual cost of the campaign as configured by your organization subtracted from the total revenue attributed to a campaign divided by the actual cost of the campaign as configured by your organization (Attributed Revenue - Actual Cost / Actual Cost) |
| Influenced ROI | The sum of the actual cost of the campaign subtracted from the total revenue of an opportunity which is evenly distributed to all the campaigns associated with that opportunity divided by the actual cost of the campaign (Influenced Revenue - Actual Cost / Actual Cost) |
| Actual Cost | The actual cost of the campaign as configured by your organization |
| Percent of Total Won (Influenced) | Total Influenced Opportunities Won / (Total Attributed Opportunities Won + Total Influenced Opportunities Won |
| Percent of Won (Attributed) | Total Attributed Opportunities Won / (Total Attributed Opportunities Won + Total Influenced Opportunities Won) |
Understanding the charts on the dashboard
Attributed revenue by top campaigns
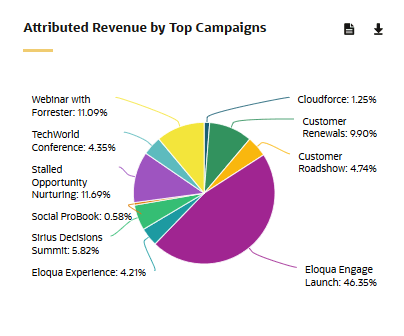
This chart shows the top 10 campaigns by total attributed revenue. Upon hover, campaign name, revenue, and percent display.
Influenced revenue by top campaigns
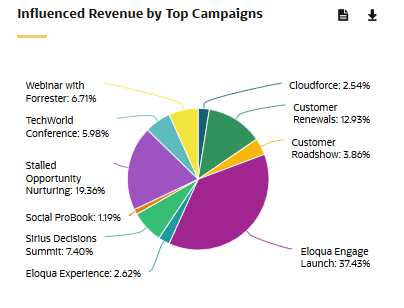
This chart shows the total influenced revenue by campaign. Upon hover, campaign name, revenue, and percent display. This chart respects the on page filter. A maximum of 10 campaigns displays.
Total won revenue
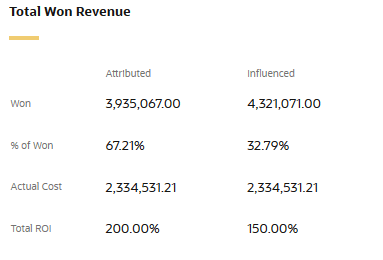
This report shows the total won revenue (won opportunities) for the date range specified.
Total possible revenue
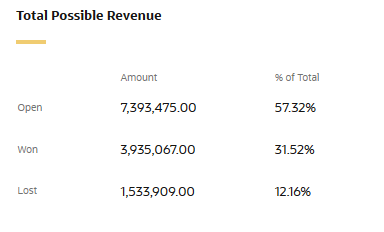
This report shows the total possible revenue (open, won and lost opportunities) for the date range specified. Won is based on Opportunities marked as Closed Won.