Adding performance tile to an analysis
This tutorial shows you how to add a Performance Tile view to your analysis. Each performance tile prominently displays a single piece of high-level aggregate data.
What you'll learn
In this tutorial, we'll show you how to:
- Create a performance tile
- Configure a performance tile's display
What you'll need
- Access to Insight
- Analyzer license
Step 1: Creating a performance tile
First, we’ll create a new performance tile that we can format and match to our data.
To create and format a performance tile:
- In Insight, click New > Analysis
 on the global header to create a new analysis. Select the Campaign Response subject area.
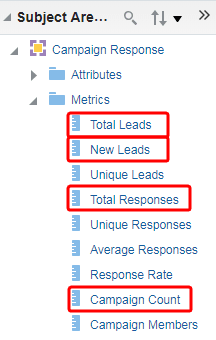
 - In the Criteria panel under Metrics, double-click on New Leads, Total Leads, Total Responses, and Campaign Count.
- Click the Results tab. Click the New View
 icon and select Performance Tile.
Review the performance tile. By default, the first measure in the analysis on the criteria tab is selected as the performance tile measure.
- Click Edit View
 in the performance tile to go to the edit window.
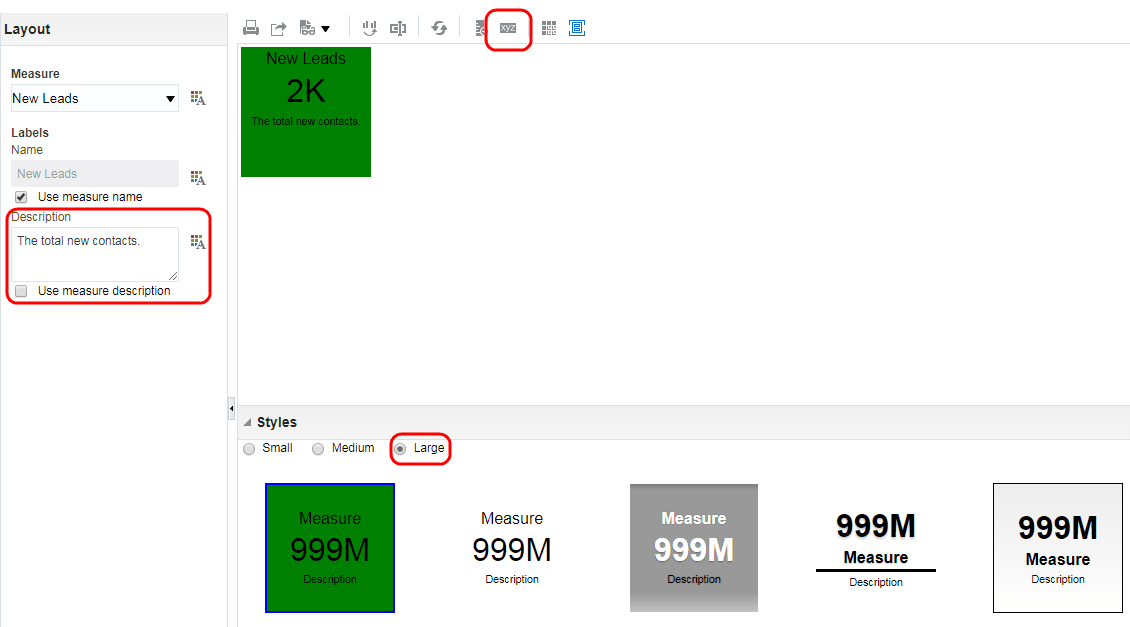
 - Make the following changes in the editor:
- Under Labels, change Description to The total new contacts.
- In the Styles panel, select Large.
- Click Performance Tile Properties
 in the toolbar and select a green for Background.
 - Click Done. The Performance Tile view is displayed with your format changes.
Step 2: Creating a second performance tile for a different measure
Next, we’ll add a second performance tile and match it to different data.
To create a second performance tile:
- Click the Results tab. Click the New View icon and select Performance Tile.
- Click the Edit View icon in the performance tile to go to the edit window.
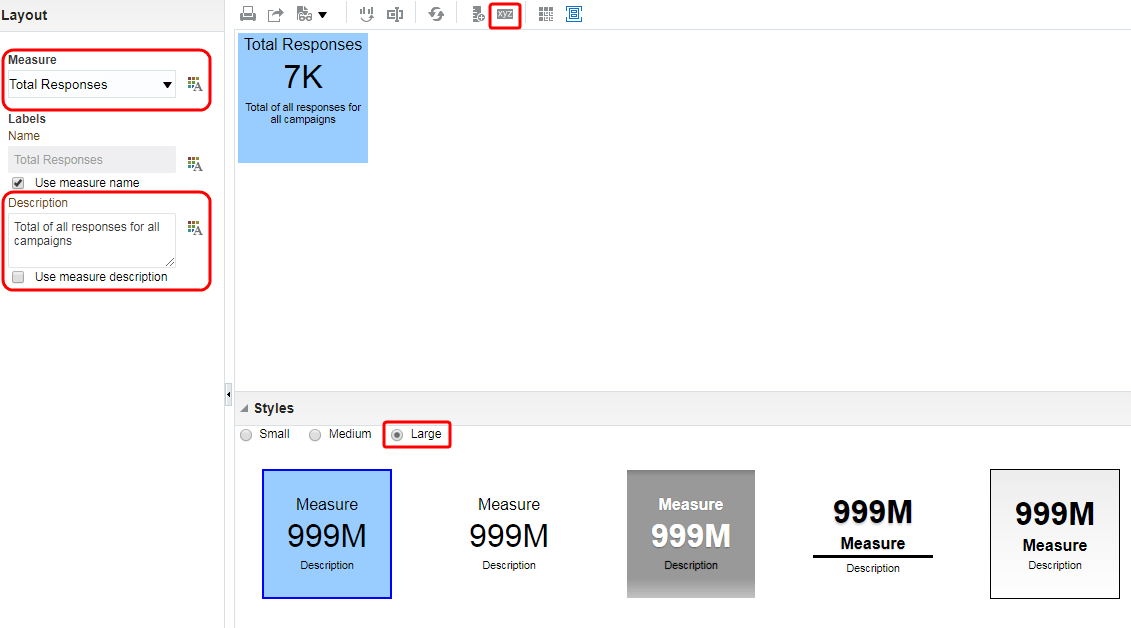
- Make the following changes in the editor:
- Under Measure, select Total Responses from the drop-down list.
- Under Labels, change Description to Total of all responses for all campaigns.
- In the Styles panel, select Large.
- Click Performance Tile Properties in the toolbar and select a blue for Background.
- Click Done. The performance tile view is displayed with your format changes.
Step 3: Configuring performance tile display
Now, we’ll modify the way our performance tiles are displayed.
To configure a performance tile's display:
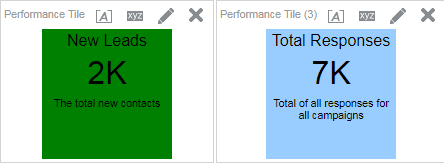
- Remove the Title and Table views from the analysis.
- Drag the performance tiles side by side.
Now that you're done
Now that you have added performance tiles to your analysis, check out Adding the trellis view to your analysis.