Overview of Analytics Reports
A report is a definition or expression for how you want to query your data. At least one dimension and one measure are required to build a report and segments are optional. Reports are assigned to a single category and can be assigned to multiple report collections. Oracle Infinity Analytics includes some standard reports, which provide you with a starting point for further ad hoc data exploration. You can also create your own reports.
Infinity offers flexible reporting and data exploration. Any report can be customized on the fly and extended with available dimensions and measures.
Dimensions in reporting are hierarchical: each subsequent dimension is filtered by the dimension that precedes it. There is a UI limit of five dimensions that can be added to a report, but this limit does not apply to the data or how it can be queried.
Data for reports is not preprocessed and aggregated in advance. When you select a report from the menu, its report definition is used to query the Infinity big data platform at the time it is selected.
Reports have the following features:
- You can dynamically add and remove measures, dimensions, and segments to reports.
- Dimension drill down: you can quickly add dimensions to a report to refine the results.
- Report segmentation, including segment comparisons, are available on every report and you can segment reports on the fly.
- Every report can be interrogated ad hoc.
- Your report changes are available immediately and do not require re-analysis.
- Unique user counts are available in all reports and are consistent across time boundaries.
Viewing reports
Oracle Infinity reports are actually report definitions and are not preprocessed. They can be evaluated on the fly and become the starting point for further ad hoc exploration. You can drill down to a depth of five dimensions on any report (except for funnel analysis reports) and can add or remove dimensions, measures, or segments in order to find the answers needed.
To view reports:
- Sign in to Oracle Infinity then click
 > Analytics.
The Analytics page displays:
- Your collections in the main section. A collection is a set of reports that share a common segment or set of segments to provide a view into your data. Each collection has a name, a set of segments, a set of reports, and permissions. Access to collection can be made available to all users or restricted to a specific group of users.
- Breadcrumbs of your current location
- A report menu for each collection
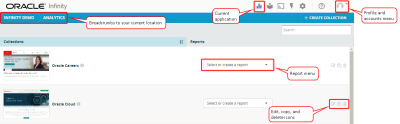
- Navigate to a specific report by selecting it from the collection's report list.
- The report is displayed and you can navigate to other reports in this collection via the left-hand panel.


How reports are organized

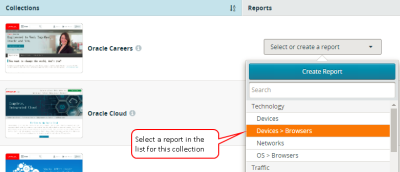
When you select a report from the drop-down list, the report is loaded and new navigation options are displayed:
- Categories: Toward the left of the report page is the list of categories, such as Campaigns, Content, and Mobile App, which allow you to navigate to other reports in this collection. The number to the right of each category represents the number of reports in that category. For more details about report categories, see editing a report.
- Search for a report: You can search for reports by entering a keyword in the search field near the top of the report list.
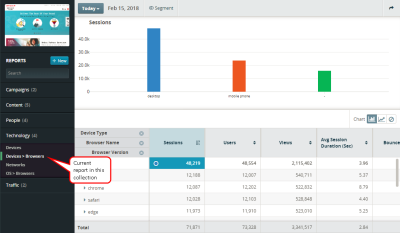
- Select a date range: The default date range is Today, but you can select a different date range.
- Add a segment: You can add a segment to filter a report.
- Click Search
 to display options for searching your report data.
 - Dimension column: The first column on the left displays a hierarchical view of the report's dimensions.
- Measures: Measure columns display values that are applied to the report's dimensions. You can add, remove, and change the order of measures in your reports.
- Save As: You can click Save As to copy a report.
- Chart type: You can display a trend line or bar chart for report data or hide the chart to focus on data in the report table.
- Report table: Oracle Infinity Analytics' report table is an intuitive canvas for examining your data based on dimensions and measures.