19 Monitoring and Managing Oracle Mediator Service Components and Engines
This chapter includes the following topics:
For more information, see the following sections:
In addition to monitoring Mediator components using Oracle Enterprise Manager Fusion Middleware Control, you can also set up watches and notifications for resequencing groups have stopped processing but still have messages pending. You can also run a diagnostic dump with this information. For more information, see Diagnosing Problems with SOA Composite Applications.
Introduction to the Oracle Mediator Component Dashboard Page
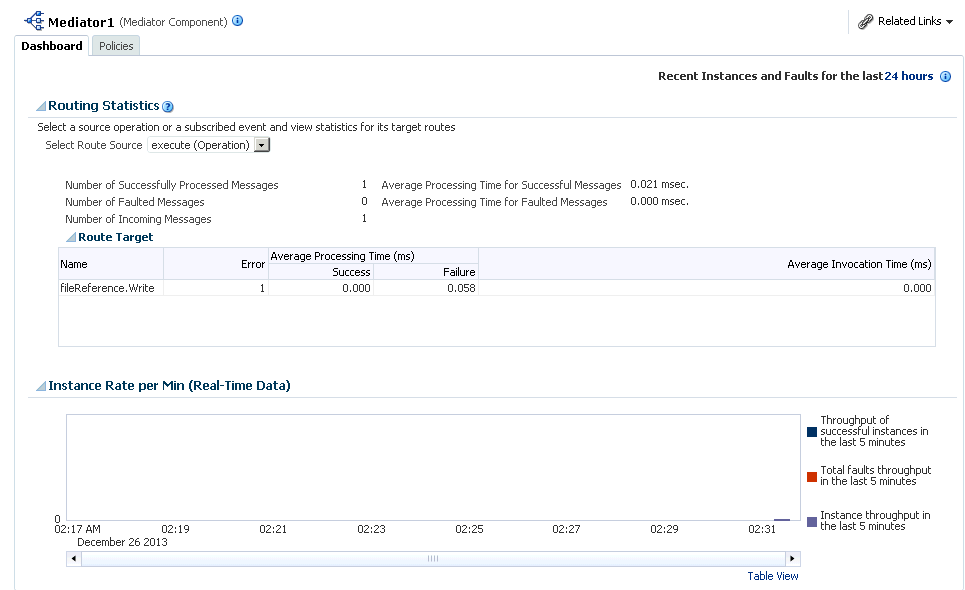
The Mediator Component Dashboard lets you view information about the current state of the selected Mediator service component. This information includes routing statistics and statistics on successful, failed, and pending instances.
Each section of the dashboard includes links to further information that can help you monitor the status of your environment. The following sections describe the instance information in the different sections of the Dashboard page.
Routing Statistics Section
The Routing Statistics section includes the following information about the routing data of a source operation or subscribed event:
-
Number of Successfully Processed Messages: The number of messages successfully processed for the selected route source.
-
Number of Faulted Messages: The number of messages that threw faults for the selected route source.
-
Number of Incoming Messages: The total number of incoming messages for the selected route source.
-
Average Processing Time for Successful Messages: The average time taken to process each successful message for the selected route source.
-
Average Processing Time for Faulted Massages -The average time taken to process each faulted message.
The Route Target subsection in the Routing Statistics section displays statistics of the target routes for the Mediator service component. This section provides the following information about an instance:
-
Name: The name of the route target of the Mediator service component.
-
Error: The number of errors that occurred during routing.
-
Average Processing Time: The average processing time for the instances of the Mediator service component. This field has two subfields, Success and Failure. The Success subfield shows the average processing time for the instances of the Mediator service component that were processed successfully. The Failure subfield shows the average processing time for the instances of the specific Mediator service component that failed to process successfully.
-
Average Invocation Time: The average invocation time for the instances of the Mediator service component.
Instance Rate Per Min Section
The Instance Rate Per Min section provides information about the execution rate of the Mediator instances per minute. This section displays a graph that shows real-time data for successful, faulted, and incoming instances in the last five minutes.
You can view the instance rate for the last five minutes in tabular form by clicking Table View.
Monitoring and Managing an Oracle Mediator Service Component
You can perform any of the following component-level monitoring and management tasks from the Mediator Component home page in Oracle Enterprise Manager Fusion Middleware Control:
Monitoring Oracle Mediator Service Component Routing Statistics and Instances
The Mediator Component Dashboard displays routing statistics and instance-related information.
To monitor Mediator service component routing statistics and instances:
-
Access the SOA Composite home Page through one of the following options:
From the SOA Infrastructure Menu... From the SOA Folder in the Navigator... -
Select Home.
-
Select the Deployed Composites tab.
-
In the Composite section, select a specific SOA composite application.
-
Expand soa-infra, and then select a specific SOA composite application.
-
-
In the Components section, select the Mediator service component.
-
Click the Dashboard tab.
The Dashboard page displays the information described in Introduction to the Component Dashboard Page.
-
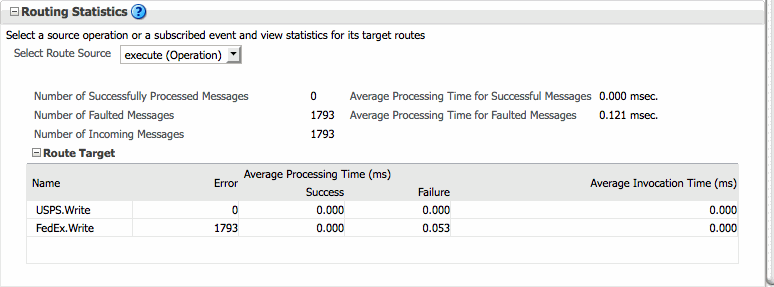
Expand the Routing Statistics section and select an operation or event in the Select Route Source field.
View the statistics for the selected operation or event. To view additional information, expand the Route Target section.
-
View the routing statistics for all targets in the Route Target table.
For information about the fields displayed in the Routing Statistics section, see Routing Statistics Section.
-
Expand the Instance Rate per Min (Real-Time Data) section to view a graphical representation of the number of successful, faulted, and incoming (pending) instances of the Mediator service component over a specific time range.
Click Table View to display the same information in a tabular format.
For more information, see Introduction to Business Flow Instances. For information about viewing and searching log files, see Administering Oracle Fusion Middleware.
Managing Oracle Mediator Policies
Oracle Fusion Middleware uses a policy-based model to manage web services. Policies apply behavioral requirements and security to the delivery of messages. You can view, attach, and detach policies for Mediator service components in currently deployed SOA composite applications.
The Policies page of the Mediator Component Home page provides the following information about a Mediator component:
-
Policy Name: The name of the policy.
-
Policy Reference Status: A toggle button that allows you to enable or disable a policy. Disabling a policy temporarily turns it off without detaching it. If the button says Disable, the policy is enabled; if it says Enable, the policy is disabled.
-
Category: The category of the policy. It has the following values: Management, Reliable Messaging, MTOM Attachments, Security, and WS-Addressing.
-
Total Violations: The total number of violations since the SOA Infrastructure was restarted.
-
Security Violation: The number of violations in each category. Category can have the following values: Authentication, Authorization, Confidentiality, and Integrity.
To manage Mediator policies:
-
Access the SOA Composite home page through one of the following options:
From the SOA Infrastructure Menu... From the SOA Folder in the Navigator... -
Select Home.
-
Select the Deployed Composites tab.
-
In the Composite section, select a specific SOA composite application.
-
Under soa-infra, select a specific SOA composite application.
-
-
Select the Mediator service component in the Components section.
-
Click the Policies tab.
-
View the policies attached to a Mediator component.
-
Click Attach/Detach to attach or detach a policy.
-
If multiple components are available, select the service or component to which you want to attach the policy.
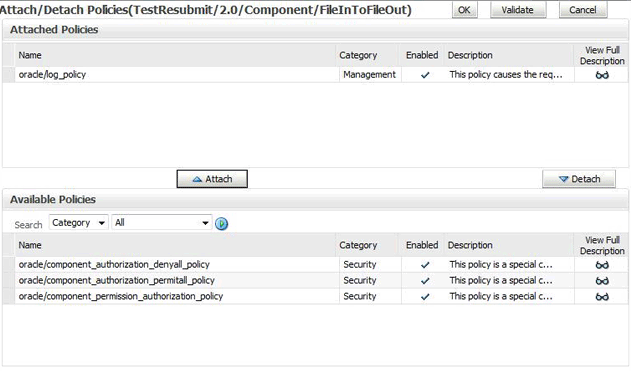
The Attach/Detach Policies page appears with all attached policies displayed in the upper pane and all available policies displayed in the lower pane.
-
To attach a policy, select the policy in the lower pane and then click Attach.
-
To detach a policy, select the policy in the upper pane and then click Detach.
-
When you finish attaching or detaching policies, click Validate.
-
If any validation errors occur, make the necessary corrections and run the validation until no more errors occur.
-
Click OK.
The dialog closes and the attached policies appear in the policies table.
For more information, see the following documentation:
-
Managing SOA Composite Application Policies for the dialogs that are displayed during policy attachment
Monitoring an Oracle Mediator Service Engine
You can perform the following monitoring tasks at the Mediator service engine level from the Dashboard tab of the Mediator Engine home page in Oracle Enterprise Manager Middleware Control.
Monitoring Request Breakdown Statistics
You can assess the efficiency level of the Mediator service engine by monitoring the request breakdown statistics.
To monitor the request breakdown statistics of the currently deployed Mediator service components:
-
Access the Mediator Engine home page through one of the following options:
From the SOA Infrastructure Menu... From the SOA Folder in the Navigator... -
Select Service Engines > Mediator.
-
Right-click soa-infra.
-
Select Service Engines > Mediator.
The Mediator Engine home page appears.
-
-
Click the Statistics tab.
-
View the request breakdown statistics.
The Request Breakdown section provides information about the count and the average time taken for processing the following actions:
-
Invoke One Way: One-way invocations from the Mediator service engine.
-
Transformation: Transforming messages in the Mediator service engine.
-
Enqueue: Dehydrating messages for parallel routing rules.
Note:
Dehydrating of messages means storing the incoming messages in the database for parallel routing rules for processing later by worker threads.
-
Invoke: Request-response invocations from the Mediator Service Engine.
-
Publish: Publishing events from the Mediator service engine.
-
Condition Evaluation: Filtering conditions for evaluation by the Mediator service engine.
-
Validation: Message validations by the Mediator service engine.
-
Monitoring Deployed Oracle Mediator Service Components in the Service Engine
You can monitor all deployed SOA composite applications with Mediator service components running in the service engine.
To monitor deployed Mediator components in service engines:
-
Access the Mediator Engine home page through one of the following options:
From the SOA Infrastructure Menu... From the SOA Folder in the Navigator... -
Select Service Engines > Mediator.
-
Right-click soa-infra.
-
Select Service Engines > Mediator.
-
-
Click the Deployed Components tab.
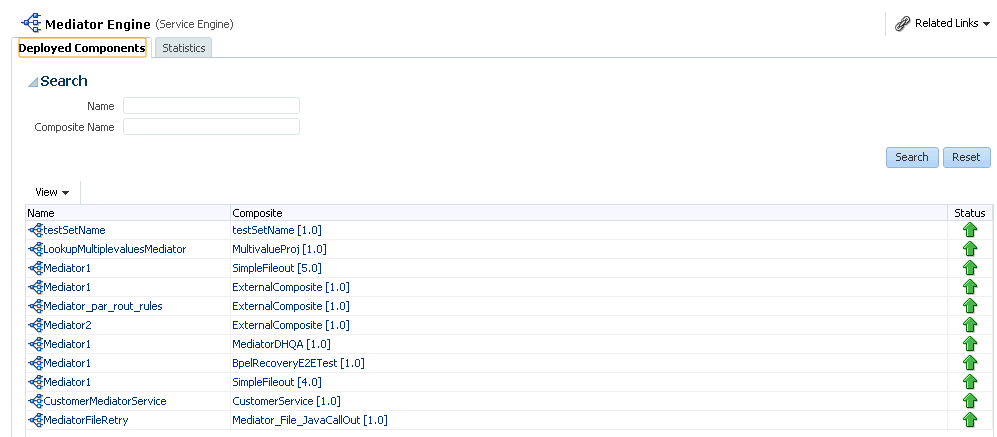
The Deployed Components page includes two sections. The upper section lets you search for the components to view and the lower section displays information about the components returned by the search.
-
In the Name column, click a specific service component to access its home page.
-
In the Composite column, click a specific SOA composite application to access its home page.
Monitoring Resequencing Groups
You can use the Mediator Resequencing Groups page to view and manage resequencing groups for the Mediator.
Note:
The Mediator Component page or Mediator Engine (service engine) page cannot be used to access, or configure, resequencer related information.
Use the Mediator Resequencing Groups page and the Flow Instances page to manage and monitor all Mediator resequencer groups, and to perform actions like fault recovery.
Resequencing enables the Mediator to have the out-of-sync messages put back into order. See "Resequencing in Oracle Mediator" in Developing SOA Applications with Oracle SOA Suite for details on resequencing.
To monitor resequencing groups:
-
Access the Mediator Resequencing Groups page through one of the following options:
-
To monitor resequencing groups at the SOA Infrastructure level:
From the SOA Infrastructure Menu... From the SOA Folder in the Navigator... -
Select Resequencing Groups.
-
Right-click soa-infra (server_name).
-
Select Resequencing Groups.
The Mediator Resequencing Groups page appears. shows the Mediator Resequencing Groups page.
-
-
To monitor resequencing groups at the individual partition level:
From the SOA Partition Menu of a Specific Partition... From the SOA Folder in the Navigator... -
Select Resequencing Groups.
-
Expand SOA > soa-infra (server_name).
-
Right-click a specific partition.
-
Select Resequencing Groups.
The Mediator Resequencing Groups page appears.
-
-
-
Select the time period to find all resequencing groups processed within the specified period.
-
Click Find Resequencing Groups. Details for all resequencing groups processed within the specified period are displayed. The details include the following:
-
Group: Displays the resequencing group name. Click on any group name to see details like the last processed sequence ID, next sequence ID, and so on.
-
Group Location: Displays the location for the resequencing group. The location comprises of the component name, composite name, and the name of the partition where the composite is deployed.
-
Group State: Displays the state of the resequencing group. This can be one of Faulted, TimedOut, or Running.
-
Last Processing Time: Displays the timestamp when a message in the group was last processed.
-
Backlog Messages: Displays the number of pending messages for the resequencing group.
-
-
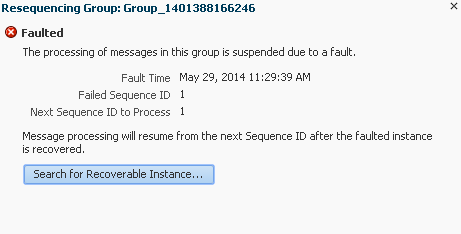
Click a group name to show the group details:
-
If you click a Group with a Faulted Group State, the following group details are shown:
-
Fault Time
-
Failed Sequence ID
-
Next Sequence ID to Process
You can click Search for Recoverable Instance to navigate to the Flow Instances tab where you can recover the faulted instance.
-
-
If you click a Timed Out Group, the following group details are shown:
-
Last Message Processing Time
-
Last Processed Sequence ID
-
Next Sequence ID to Process
You can click Skip to unlock the group and start processing the next available sequence ID.
-
-
If you click a Running Group, the following details are shown:
-
If the mediator's resequencer type is not Standard, then the following message is displayed:
Now processing the messages
-
If the mediator's resequencer type is Standard, then the following details are shown:
* Last Message Process Time
* Last Processed Sequence ID
* Next Sequence ID to Process
You can click Skip to skip to the next available instance.
-
-
-
Click Flow Instances on the Mediator Resequencing Groups page to show the business flow instances corresponding to the group. See Tracking Business Flow Instances for details on working with the flow instances page.
-
Click Recoverable Instance to show the recoverable flow instances corresponding to the group. See Recovering from Faults in a Business Flow Instance for details on recovering from faults.
