The name of the Store target will be the name of the Store as configured in the NoSQL Database CLI's "configure" command. For more information, see configure. This name must be unique across all instances of NoSQL Database that will be monitored by a given instance of EM.
Member components of the store have target names made up
of their component IDs appended to the store name. For
example, in a store named myStore, a Storage Node Agent
with an id of "sn1" will have the target name "myStore-sn1",
a Replication Node with an id of "rg1-rn1" will have the
target name "myStore-rg1-rn1", and so forth. The undeployed
StorageNodes will be "UNREGISTERED-hostname-port", for
example, “UNREGISTERED-example1.oracle.com-5050". Once the
components of a store have been added, you can find the
page representing the store by searching for the store
name in the “Search Target Name” box in the upper right
part of EM's home page. You can also find it via
Targets->All Targets or
Targets->Systems.
Clicking on the Store's name in any of the lists will take you to the Store's target page.
-
The page has two large graphs showing the:
-
Average Latency Averaged over all Replication Nodes in the Store
-
Total Throughput for all Replication Nodes

-
-
In the lower right is a list of “Undeployed Storage Node” agents.
-
In the lower middle is a list of “Incidents and Problems” related to the store.
-
On the left side of the page is the “Store Navigation” panel. This panel presents the topology of the store in three different ways:
-
Types
“By Types” groups targets by their target types; so all Replication Nodes are listed together, all Storage nodes are together, and so forth.
-
StorageNodes
“By StorageNodes” shows the hierarchy of
Store->Storage Node->Replication Node. Each Replication Node is managed by a Storage Node Agent, and always resides on the same host. A Storage Node Agent may manage more than one Replication Node, and this is reflected in the tree layout of the navigation panel. -
Shard
“By Shards” shows the hierarchy of
Store->Shard->Replication Node.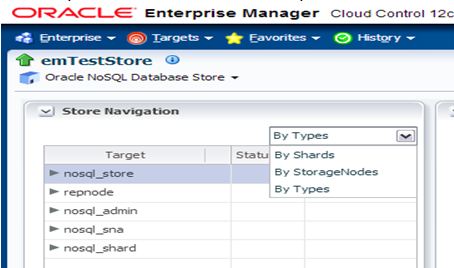
-
-
Each component in the navigation panel has a status "up" or "down", or "unknown" and a link to the target page (labeled "Home Page") for that component. The status can be "unknown" if the targets have yet to be reported for the first time, or if OMS cannot contact the EM Agent.
-
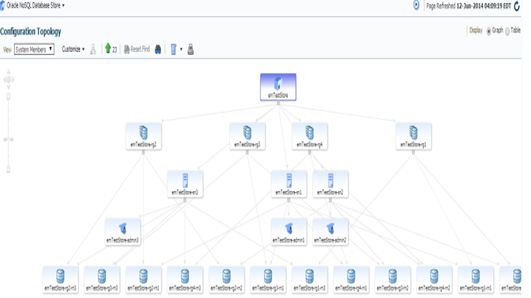
The “Store” page, (under menu item Members->Topology) shows the layout of the store as a graph, which is an overview of the "Configuration Topology".
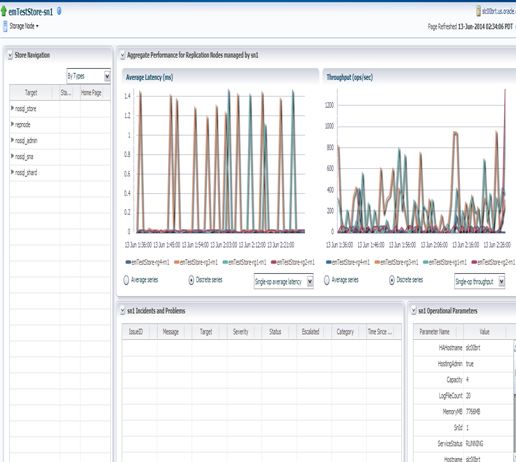
On the “Storage Node” page, you see the same graphs of “Average Latency” and “Throughput”. Here, the graphs show aggregate information for the Replication Nodes that are managed by the Storage Node. The graphs display either discrete series, with one line per Replication Node; or it can combine the series into a single line. The choice is made using the radio buttons at the bottom of the graph.
This page also shows the operational parameters for the Storage Node Agent.
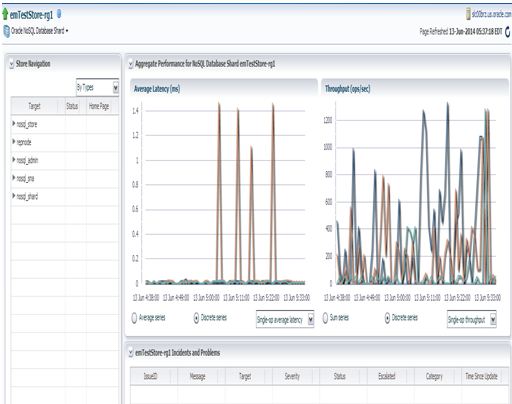
The “Shard” page is similar to the "Storage Node" page. It shows metrics collected from multiple Replication Nodes. These Replication Nodes are the ones that serve as the replication group for the Shard.
The “Replication Node” page shows metrics for a single replication node. This page also shows the Replication Node's operational parameters.

On this page you can view a variety of metrics by choosing
Replication Node->Monitoring->All Metrics.
It also shows different time ranges.

From here you can examine and graph any of the numerous metric values that are collected from the Replication Node.