11.4 Creating Maps

App Builder includes built-in wizards for generating map charts on pages with a Desktop user interface. How you create a map chart depends upon whether you are adding the map to an existing page, or adding a map on a new page.

11.4.1 About Map Chart Support

Map chart support in Oracle Application Express is based on the AnyChart AnyMap Interactive Maps Component.

AnyMap is a flexible Macromedia Flash-based solution that enables developers to visualize geographical related data. Map charts are rendered by a browser and require Flash Player 9 or later. For more information about AnyChart, go to http://www.anychart.com

AnyChart stores map data in files with a *.amap extension, and supports 300 map files for the United States of America, Europe, Asia, Europe, Africa, Oceania, North America, and South America. To render a desired map, you select the map source in the wizard (for example, Germany) and the map XML automatically references the desired map source .amap file, germany.amap. To browse through the available maps, see "Map Reference" in AnyChart User's Guide: http://6.anychart.com/products/anymap/docs/

11.4.2 About Creating SQL Queries for Maps

You define a map chart by providing a SQL query with a specific syntax.

When you define a map chart providing a SQL query using the following syntax:

SELECT link, label, value
FROM   ...

Where:

  • link is a URL.

  • label is the text that identifies the point on the map with which you want to associate data. The Region ID or Region Name of the map will be used as the label.

  • value is the numeric column that defines the data to be associated with a point on the map.

Consider the following example when creating a new page:

  1. On the Workspace home page, click the App Builder icon.

  2. Select an application.

  3. Click Create Page.

  4. Click Chart.

  5. Select Map Chart.

  6. For Map Type, select United States of America and click Next.

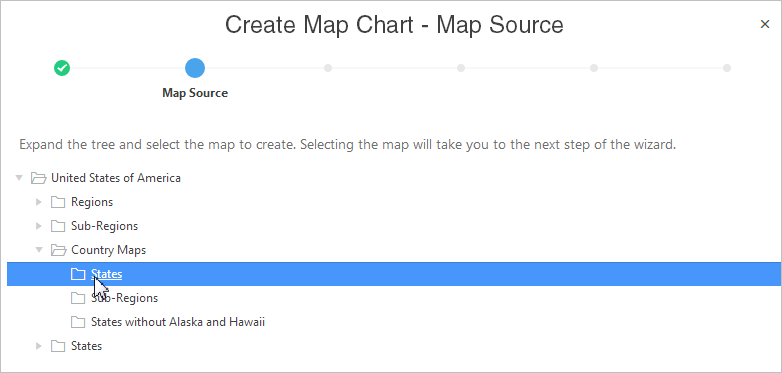
  7. For Map Source, expand Country Maps and select States.

  8. For Page Attributes specify the appropriate attributes and click Next.

  9. For Navigation Preference, specify the type of navigation to include on this page and click Next. The navigation options (for example, navigation menu or tabs) depends upon the current application theme.

  10. For Map Attributes, select the appropriate attributes and click Next.

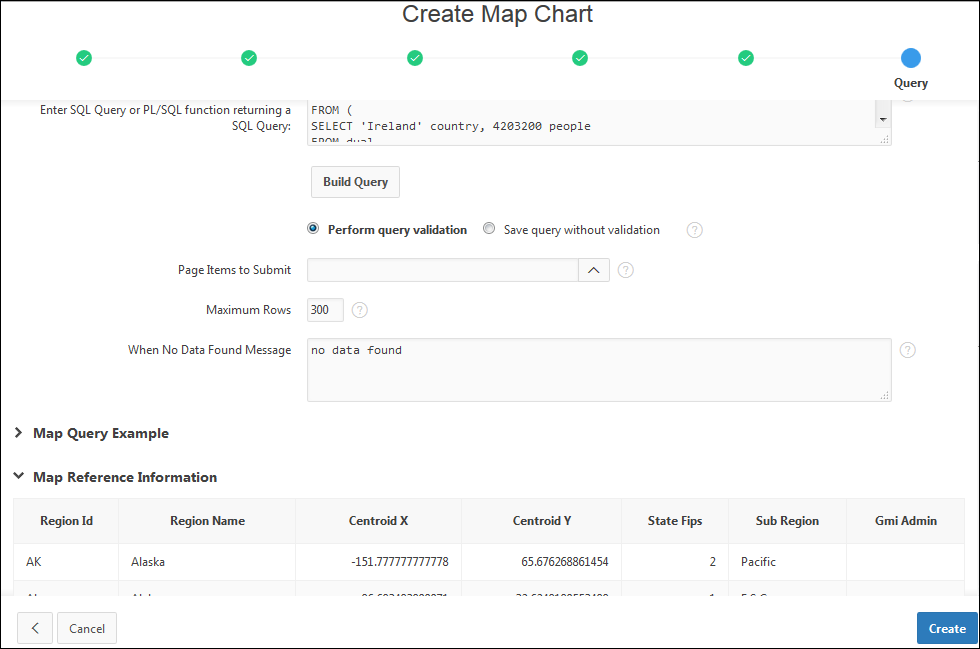
    The Query page appears.

  11. Scroll down and expand and review the Map Query Example and Map Reference Information regions.

  12. Scroll down and expand and review the Map Reference Information region at the bottom of the page.

    Specify a SQL query by either:

    • Entering a SQL query in the field provided. See "About Creating SQL Queries for Maps."

    • Clicking the Build Query button. When the Build Chart Query Wizard appears, follow the on-screen instructions.

    When you create your query, you must incorporate the region name information as described in the Map Reference Information region. The following example includes information for Florida and Alaska:

    SELECT null link, region label, value Populations
    FROM (
    SELECT 'Florida' region, 18328340 value FROM dual
    UNION ALL
    SELECT 'Alaska' region, 686293 value FROM dual)
    

    Note:

    If you are referencing geographical information stored in a database table, the information must correspond with the Region information associated with the map source. For more information, see AnyChart User's Guide: http://6.anychart.com/products/anymap/docs/

    Click Create.

11.4.3 Adding a Map Chart to a New Page

Add a map chart to a page by running the Create Page Wizard.

To add a map chart on a new page:

  1. On the Workspace home page, click the App Builder icon.
  2. Select an application.
  3. Click Create Page.
    The Create Page Wizard appears.
  4. For Create a Page:
    1. User Interface - Select a user interface for the page.

      This attribute only displays for applications using older themes and for which Desktop and Mobile User Interfaces have been defined.

    2. Select a page type - Select Chart.

  5. On Create Chart, select Map Chart.
  6. On Create Page, select a map type (for example, Europe), and click Next.
  7. On Create Map Chart, expand the tree and select the map to create.
  8. For Page Attributes:
    1. Page Number - Select a page in which the chart object is to appear.
    2. Page Name - If creating a new page, enter a page name.
    3. Page Mode - Select a page mode.
    4. Breadcrumb - Select whether you want to use a breadcrumb navigation control on your page, and which breadcrumb navigation control you want to use
    5. Click Next.
  9. On Navigation Menu, specify a Navigation Preference to include on this page and click Next. The navigation options (for example, navigation menu or tabs) depends upon the current application theme.
  10. For Map Attributes, select the appropriate attributes and click Next.

    Note:

    To learn more about an attribute, see field-level Help.

  11. Specify a query by either:
    • Entering a SQL query in the field provided.
    • Clicking the Build Query button. When the Build Chart Query Wizard appears, follow the on-screen instructions.

    Specify relevant attributes. To view map reference information associated with your selected Map Source, expand the Map Reference Information region at the bottom of the page.

    To associate data with geographical locations, you must incorporate information from the Region Name or Region ID columns into the Map query.

  12. Click Create.

11.4.4 Adding a Map Chart in Page Designer

Add a map chart by manually creating it in Page Designer.

To add a map chart to an existing page.

  1. View the page in Page Designer:
    1. On the Workspace home page, click the App Builder icon.
    2. Select an application.
    3. Select a page.
    Page Designer appears.
  2. From the Gallery select the Map Chart region and drag it to the appropriate location in the Layout tab.

    Tip:

    You can also right-click Map Chart region, select Add To, and select the appropriate location.

    Page Designer indicates what actions are required next.

    The Messages tab displays a red or yellow badge indicating messages you need to address. The Message tab displays two types of messages:

    • Errors - Error messages display in red. Selecting an error message displays the associated attribute in red in the Property Editor. You must address errors before a page can be saved.

    • Warnings - Warning messages display in yellow. Selecting a warning message displays the associated attribute in yellow in the Property Editor. You must address errors before a page can be saved. Note you can save a page without addressing warning messages.

  3. In the Property Editor, edit the following attributes.

    Tip:

    To learn more about an attribute, select the attribute in the Property Editor and click the Help tab in the center pane.

    1. Title - Enter a title for the region.

    2. Layout:

      • Sequence - Enter the display sequence for this item.

      • Parent Region - Select the parent region to which this region belongs.

      • Position - Select the template position used to display this region.

    3. Appearance:

      • Template - Select a region template.

      • Item Display Position - Specify where page items display in relation to the main region content.

    4. Layout - Specify the Sequence, Parent Region, and Position.

    5. Appearance - Specify the template.

  4. View the Map Chart attributes. In the Rendering tab, under the map chart title, select the Attributes node.

    In the Property Editor, edit the following Map attributes:

    1. Map, Level 1 - Select the map level from the available list (for example Europe).

    2. Map, Level 2 - Select the map level from the available list (for example, Denmark).

    3. Source, SQL Query - Enter the SQL Query for the chart series.

    4. Edit other attributes as appropriate.

      Tip:

      To learn more about an attribute, select the attribute in the Property Editor and click the Help tab in the center pane.

  5. Click Save.

11.4.5 Managing Map Charts

Once you create a map chart, you can alter its display by editing attributes in the Property Editor.

11.4.5.1 Editing Map Chart Attributes

To view the map chart attributes:

  1. View the page in Page Designer:
    1. On the Workspace home page, click the App Builder icon.
    2. Select an application.
    3. Select a page.
    Page Designer appears.
  2. To edit region attributes:
    1. In the Rendering tab, select the region that containing the map chart.

      The region attributes display in the Property Editor.

    2. Edit the appropriate attributes.

  3. To edit chart map attributes:
    1. In the Rendering tab, under the region title, select the Attributes node.

      The map chart attributes display in the Property Editor.

    2. Edit the appropriate attributes.

    Tip:

    To learn more about an attribute, select the attribute in the Property Editor and click the Help tab in the center pane.

  4. Click Save.

11.4.5.2 Using Custom XML with Map Charts

There are additional map settings that cannot be controlled using the standard attributes on the Map Attributes page. To further control the look and feel of a chart, you can use custom XML.

To use custom XML:

  1. View the page in Page Designer:
    1. On the Workspace home page, click the App Builder icon.
    2. Select an application.
    3. Select a page.
    Page Designer appears.
  2. In the Rendering tab, under the region title, select the Attributes node.

    The map chart attributes display in the Property Editor.

  3. Locate and expand the Custom XML.
  4. For Custom XML, Custom, select Yes.
  5. Edit the XML.
  6. Click Save.

Tip:

For more information on supported XML format for maps, see the Online Map XML Reference at:

http://6.anychart.com/products/anymap/docs/

11.4.5.3 Enabling Automatic Updates

You can create map charts that monitor information by enabling the Asynchronous Update attribute on the Map Attributes page. Enabling this attribute updates the map to reflect changes in the underlying data within a specified time interval.

To enable automatic refresh:

  1. View the page in Page Designer:
    1. On the Workspace home page, click the App Builder icon.
    2. Select an application.
    3. Select a page.
    Page Designer appears.
  2. In the Rendering tab, select the region that contains the map chart.
    The region attributes display in the Property Editor.
  3. In the Rendering tab, under the region title, select the Attributes node.
    The map chart attributes display in the Property Editor.
  4. To find a group or attribute:
    • Search for the group or attribute - Enter keywords in the Filter Properties field. The Property Editor displays the group or attributes. To return to the default display, delete the keywords.

    • Use Go to Group - Click Go to Group and select the group. To return the default display, click Go to Group again and select Expand All.

  5. Find Automatic Refresh.
    1. Automatic Refresh - Select Yes.
    2. Interval - Enter the interval in seconds between chart updates.

    Note:

    Oracle discourages very small updates intervals, such as 2 seconds, since they may cause serious database performance issues.

  6. Click Save.