3.4.3 Understanding AnyCo IT Department
Sample Websheet - AnyCo IT Department demonstrates how users can share text, data, and images using Websheet pages.
This Websheet includes hierarchical navigation between page sections and pages, formatted text that includes easily formatted links, Data Grids that display of tabular data, and content displayed in reports, interactive reports, and charts.
- Navigating Between Pages and Viewing Page Sections
- Home Page
- Projects Page
- Project Review Page
- Systems Page
- Planned Purchase Review
- Systems Budget Review
Parent topic: Understanding AnyCo IT Department Websheet
3.4.3.1 Navigating Between Pages and Viewing Page Sections
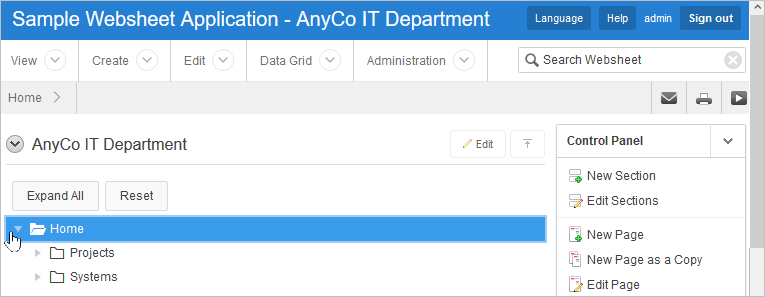
The hierarchical tree displays at the top of the home page and enables you to navigate between Websheet pages. Click the arrow to the left of the Home breadcrumb to expand or collapse the tree.
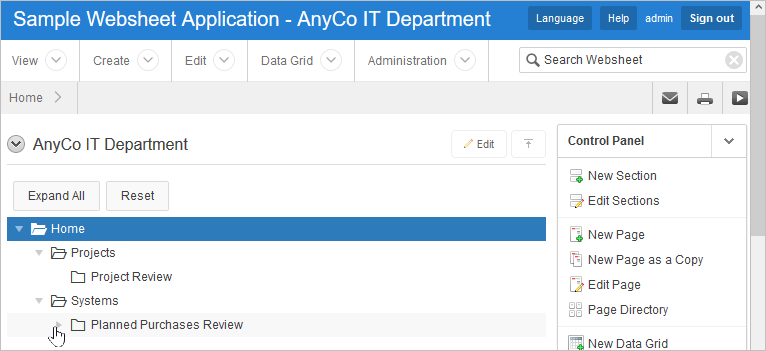
To view subsections (or children) within a section, click the arrow to the left of a section name. Click Expand All to view all pages and page subsections and Reset to return the tree to the default display. To go to another page, select the page name.
Parent topic: Understanding AnyCo IT Department
3.4.3.2 Home Page
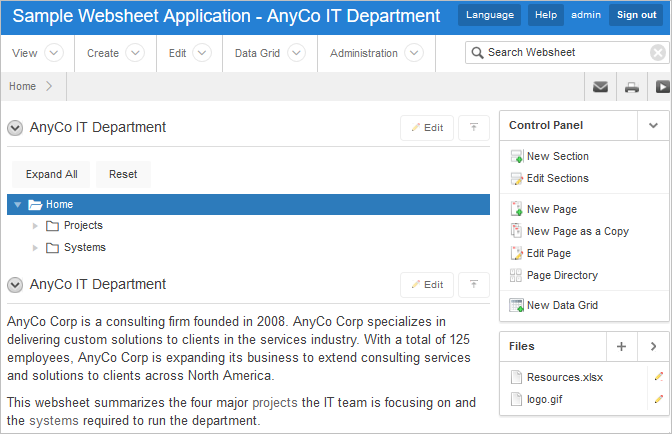
In addition to the navigation tree at the top of the page, the Sample Websheet - AnyCo IT Department home page contains three sections: AnyCo IT Department, Projects Summary, and Systems Summary.
AnyCo IT Department
AnyCo IT Department is a text section that includes links to other pages and an embedded image.
Projects Summary
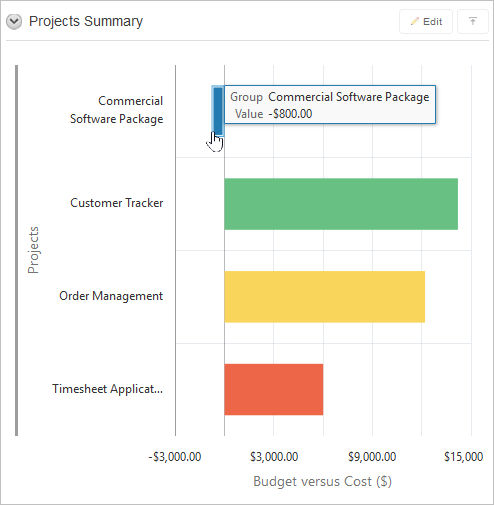
Projects Summary is a data grid that displays a chart. Passing the cursor over a bar changes the color and displays a dollar amount.
Systems Summary
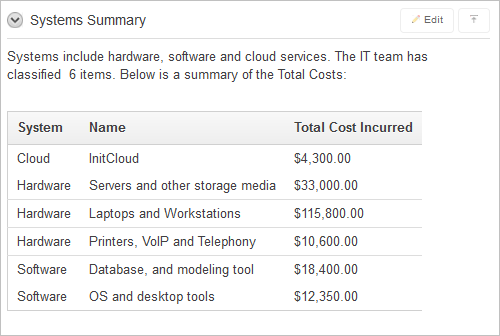
Systems Summary is a report of hardware, software, and cloud services. The bottom of the section includes links to Systems Management report and to the Systems page.
Parent topic: Understanding AnyCo IT Department
3.4.3.3 Projects Page
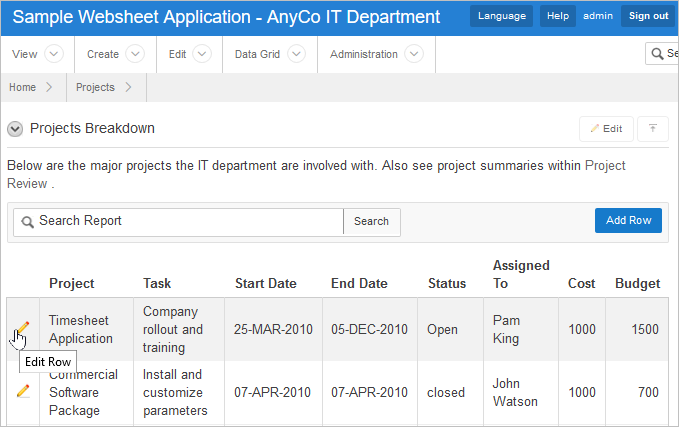
The Project contains one section, Projects Breakdown. The Projects Breakdown section includes a link to the Project Review page and an updatable report of major IT projects. To edit a specific project, click the Edit Row icon. To add another project, click the Add Row button.
Parent topic: Understanding AnyCo IT Department
3.4.3.4 Project Review Page
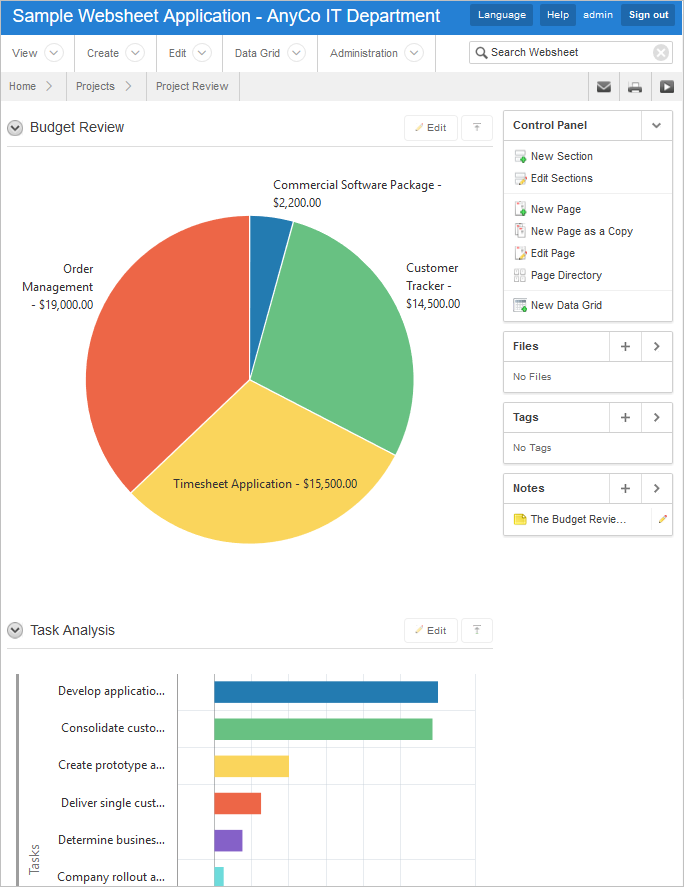
The Project Review page contains two sections, Budget Review and Task Analysis. Both sections are data grids that display as different types charts.
Parent topic: Understanding AnyCo IT Department
3.4.3.5 Systems Page
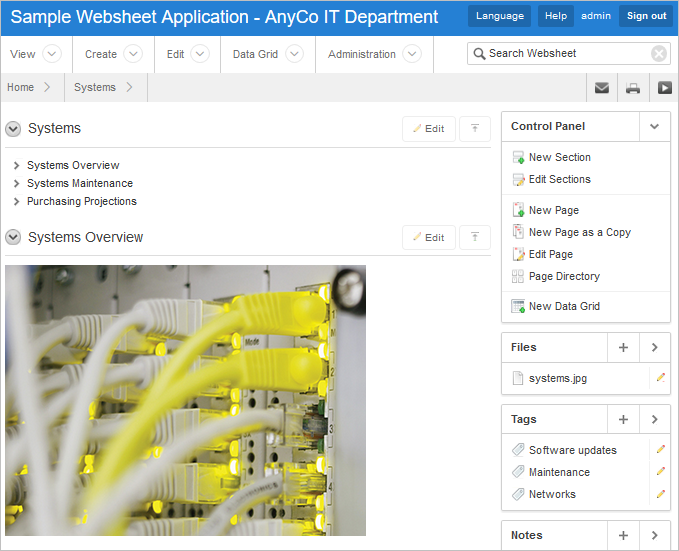
The Systems page contains the following sections:
-
Systems is a navigation section that includes links to the sections, Systems Overview, Systems Maintenance, and Purchasing Projections.
-
Systems Overview is a text section that includes an embedded image.
-
Systems Maintenance is a data grid that displays a chart. Passing the cursor over a bar changes the color and displays a dollar amount.
-
Purchasing Projections features a table that summarizes planned purchases. To add a new entry, click Add Row.
Parent topic: Understanding AnyCo IT Department
3.4.3.6 Planned Purchase Review
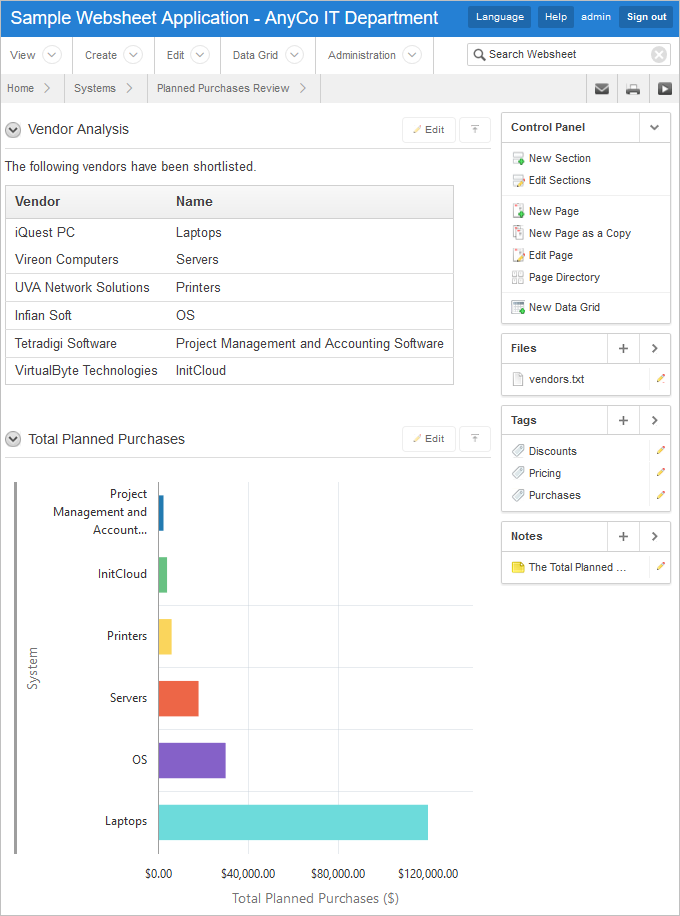
The Planned Purchase Review page contains two sections:
- Vendor Analysis is report of vendors.
- Total Planned Purchases is a data grid that displays a chart. Passing the cursor over a bar changes the color and displays a dollar amount.
Parent topic: Understanding AnyCo IT Department
3.4.3.7 Systems Budget Review
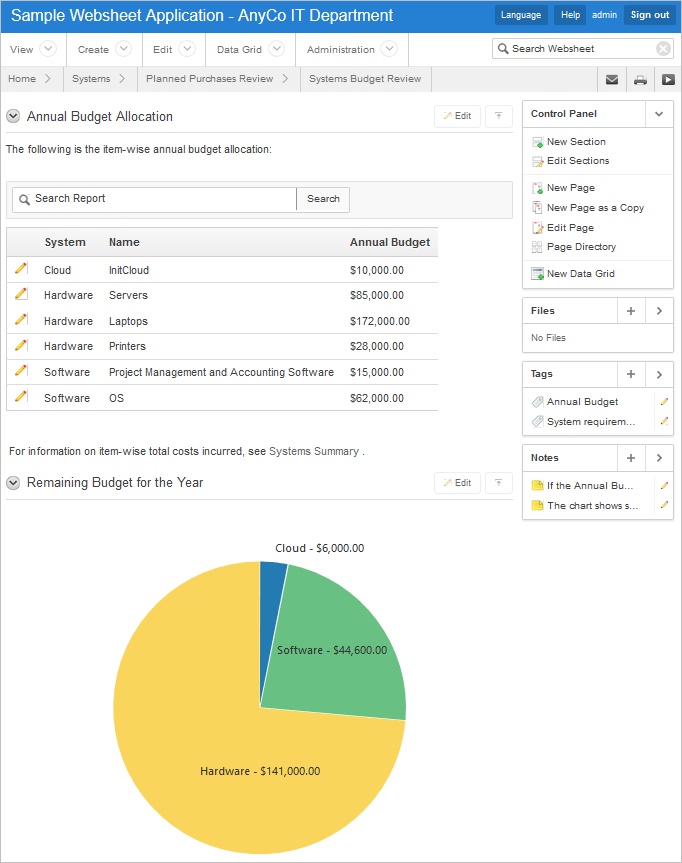
The Systems Budget Review page contains two sections:
-
Annual Budget Allocation is a report budget categories. To update report item, click the Edit Row icon.
-
Remaining Budget for the Year is a data grid that displays a pie chart. Passing the cursor over a pie section displays the dollar amount.
Parent topic: Understanding AnyCo IT Department
