CloudWatch
Monitoring is a critical aspect of maintaining the health, performance, and availability of Oracle Database@AWS deployments. Amazon CloudWatch provides a fully managed observability service that enables you to collect, analyze, and act upon operational data in real time.
With Oracle Database@AWS, key performance and infrastructure metrics are automatically published to CloudWatch under the AWS/ODB namespace. These metrics are CPU utilization, memory consumption, storage utilization, active sessions, and I/O performance across Exadata VM Cluster(s), Exadata Container Database(s) and Autonomous AI Database(s).
Amazon CloudWatch Dimensions for Oracle Database@AWS
This topic explains how to filter Oracle Database@AWS metrics by using the following dimensions.
Table 1-2 Dimensions
| Dimension | Filters |
|---|---|
cloudVmClusterId |
The identifier of a VM cluster. |
cloudExadataInfrastructureId |
The identifier of the Exadata infrastructure. |
collectionName |
A name of a collection. |
deploymentType |
The type of infrastructure. |
diskgroupName |
A name of a disk group |
errorCode |
An error code. |
errorSeverity |
The severity of an error. |
filesystemName |
The name of a file system. |
hostName |
The name of the host machine. |
instanceName |
The name of a database instance. |
instanceNumber |
The instance number of a database instance. |
ioType |
A type of I/O operation. |
jobId |
A unique identifier for a job. |
managedDatabaseGroupId |
The identifier of a Managed Database Group. |
managedDatabaseId |
The identifier of a Managed Database. |
memoryPool |
A type of memory pool. |
memoryType |
A type of memory. |
ociCloudVmClusterId |
The OCI identifier of a VM cluster. |
ociCloudExadataInfrastructureId |
The OCI identifier of the Exadata infrastructure. |
parseType |
A type of parse. |
resourceId |
The identifier of a resource. |
resourceName |
The name of a resource. |
resourceName_Database |
The name of a database. |
resourceName_DbNode |
The name of a database node. |
resourceType |
A type of database. |
schemaName |
The name of a schema. |
status |
The status of a database. |
tablespaceContents |
The contents of a tablespace. |
tablespaceName |
The name of a tablespace. |
tablespaceType |
The contents of a tablespace. |
transactionStatus |
The status of a transaction. |
type |
A type of Problematic Scheduled DMS job. |
waitClass |
A class of wait event. |
Metrics
These are the steps to monitor metrics.
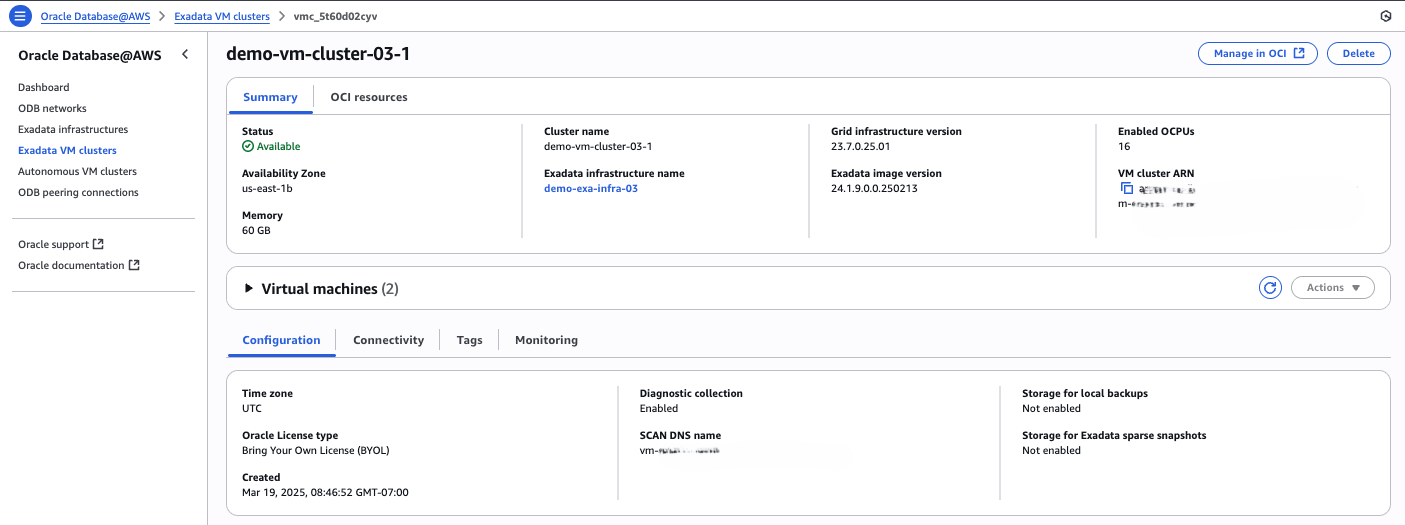
In order to view the Exadata VM Cluster metrics, you must obtain the Exadata VM Cluster name or the OCID associated with your Exadata VM Cluster.
Obtain the Exadata VM Cluster or the OCID- From the Oracle Database@AWS dashboard, navigate to Exadata VM Clusters.
- From the Exadata VM Clusters list, select the VM Cluster name link that you are using.
- From the Summary page, copy the Cluster name information as it will be required in the next section.
View the Exadata VM Cluster Metrics
- From the AWS console, navigate to CloudWatch.
- Select the region of your Exadata VM Cluster.
- Expand the Metrics section, and then select the All metrics link.
- From the All metrics page, select ODB as Namespace.
- Paste the Cluster name information that you previously obtained into the Search for any metric, dimension, resource id or account id field to start the search. The Metrics page will display the related results.
- You can select dimensions to view the respective metrics as listed below.

The following example shows the infrastructure metrics for node vm-q9rkl1 in the Exadata VM Cluster demo-vm-cluster-03-1 over a specific time frame.
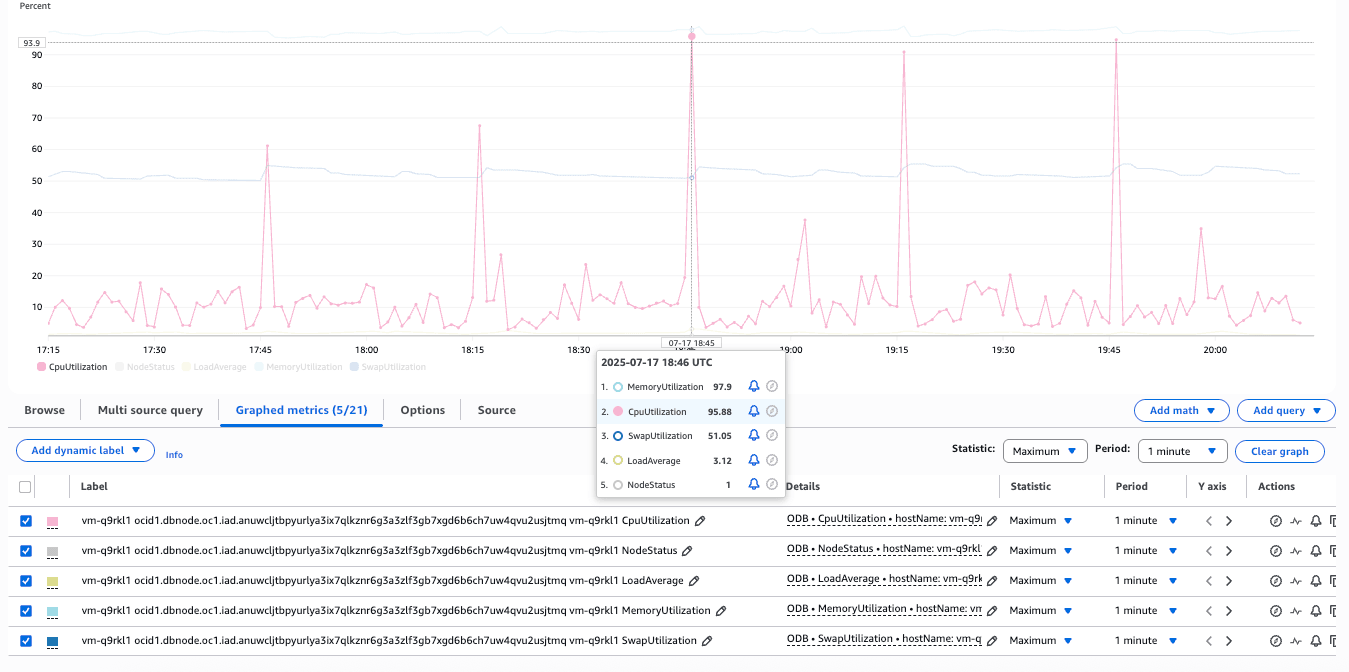
Table 1-3 Metrics
Metric Description Units ASMDiskgroupUtilizationThe percentage of usable space used in a Disk Group. Usable space is the space available for growth. The DATA disk group stores our Oracle database files. The RECO disk group contains database files for recovery, such as archives and flashback logs. Percentage CpuUtilizationThe percentage of CPU utilization. Percentage LoadAverageThe system load average is measured over 5 minutes Integer MemoryUtilizationThis is the percentage of memory available for starting new applications without swapping. You can obtain the available memory using the following command: cat /proc/meminfoPercentage NodeStatusThis indicates whether the host is reachable. Integer OcpusAllocatedThis is the number of OCPUs allocated. Integer SwapUtilizationThis indicated the percent utilization of total swap space. Percentage Exadata Container Database Metrics
These are the steps to monitor Exadata Container Database metrics.
In order to view the Exadata Container Databasemetrics, you must obtain the Exadata Container Database Name or the OCID associated with your Exadata Container Database.
Obtain the Exadata Container Database Name or Oracle SID Prefix- From Oracle Database@AWS dashboard, select Exadata VM Clusters.
- From the Exadata VM Clusters list, select your Exadata VM Cluster that you are using.
- Select the Manage in OCI button which will direct you to the Exadata VM Clusters page.
- Click on the Databases, and then select the database that you are using.
- Select the Database information tab, and then select the Copy button to obtain the OCID information as it will be required in the next section. Alternatively, you can copy the Oracle SID Prefix information.

View the Exadata Container Database Metrics- Form the AWS console, select CloudWatch.
- Select the region of your Exadata VM Cluster.
- Expand the Metrics section, and then select the All metrics link.
- From the All metrics page, select ODB as Namespace.
- Paste the OCID or Oracle SID Prefix information that you previously obtained into the Search for any metric, dimension, resource id or account id field to start the search. The Metrics page will display the related results.
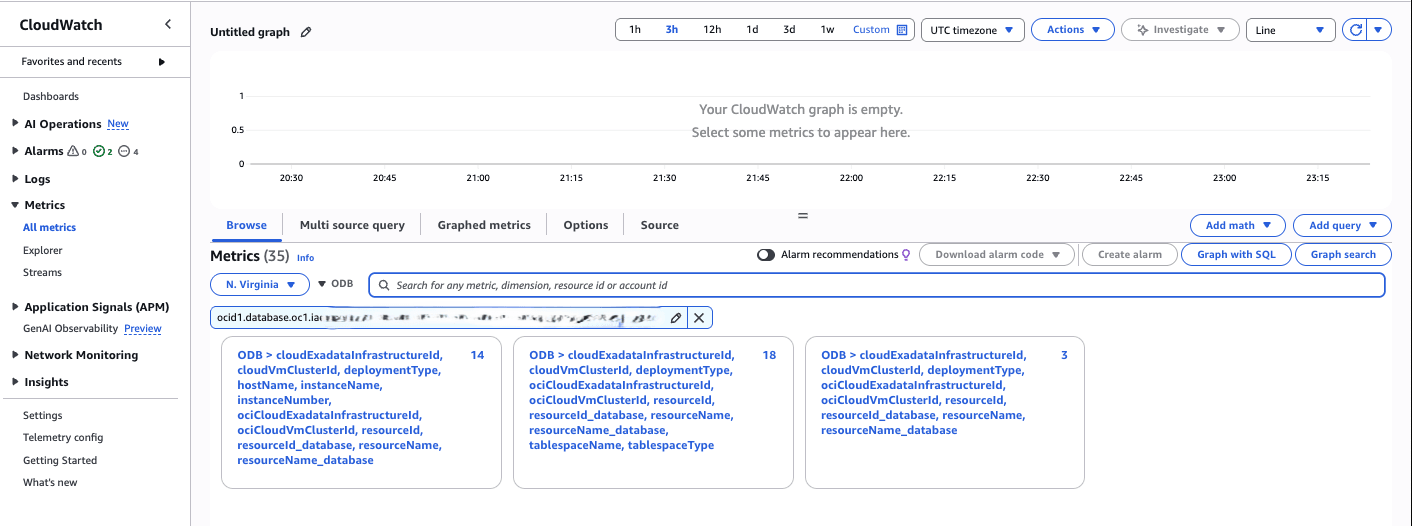
- You can select dimensions to view the respective metrics as listed below.
Table 1-4 Metrics for Exadata VM Clusters
Metric Description Units BlockChangesThis is the average number of blocks changed per second. Changes per second CpuUtilizationThe CPU utilization expressed as a percentage, aggregated across all consumer groups. The utilization percentage is reported with respect to the number of CPUs the database is allowed to use, which is two times the number of OCPUs. Percentage CurrentLogonsThe number of successful logons during the selected interval. Count ExecuteCountThe number of user and recursive calls that executed SQL statements during the selected interval. Count ParseCountThe number of hard and soft parses during the selected interval. Count StorageAllocatedTotal amount of storage space allocated to the database at the collection time. GB StorageAllocatedByTablespaceTotal amount of storage space allocated to the tablespace at the collection time. In case of container database, this metric provides root container tablespaces. GB StorageUsedTotal amount of storage space used by the database at the collection time. GB StorageUsedByTablespaceTotal amount of storage space used by tablespace at the collection time. In case of container database, this metric provides root container tablespaces. GB StorageUtilizationThe percentage of provisioned storage capacity currently in use. Represents the total allocated space for all tablespaces. Percentage StorageUtilizationByTablespaceThis indicates the percentage of storage space utilized by the tablespace at the collection time. In case of container database, this metric provides root container tablespaces. Percentage TransactionCountThe combined number of user commits and user rollbacks during the selected interval. Count UserCallsThe combined number of logons, parses, and execute calls during the selected interval.. Count Pluggable Database Metrics
Navigate to the OCI console, and then enable the Database management (Diagnostics & Management) to view the metrics. For more information, see Enable Database Management for a Pluggable Database.
Autonomous AI Database Metrics
These are the steps to monitor Autonomous AI Database metrics.
Obtain the Autonomous AI Database Name or the OCID- From Oracle Database@AWS dashboard, select Autonomous VM clusters.
- From the Autonomous VM clusters list, select the Autonomous VM cluster name link that you are using.
- Select the Manage in OCI button which will direct you to the OCI console.
- From the OCI console, select Oracle Autonomous AI Database Service on Dedicated Infrastructure, and then select Autonomous AI Databases that you are using.
- From the Autonomous AI Database information tab, copy the Database name or the OCID information as it will be required in the next section.
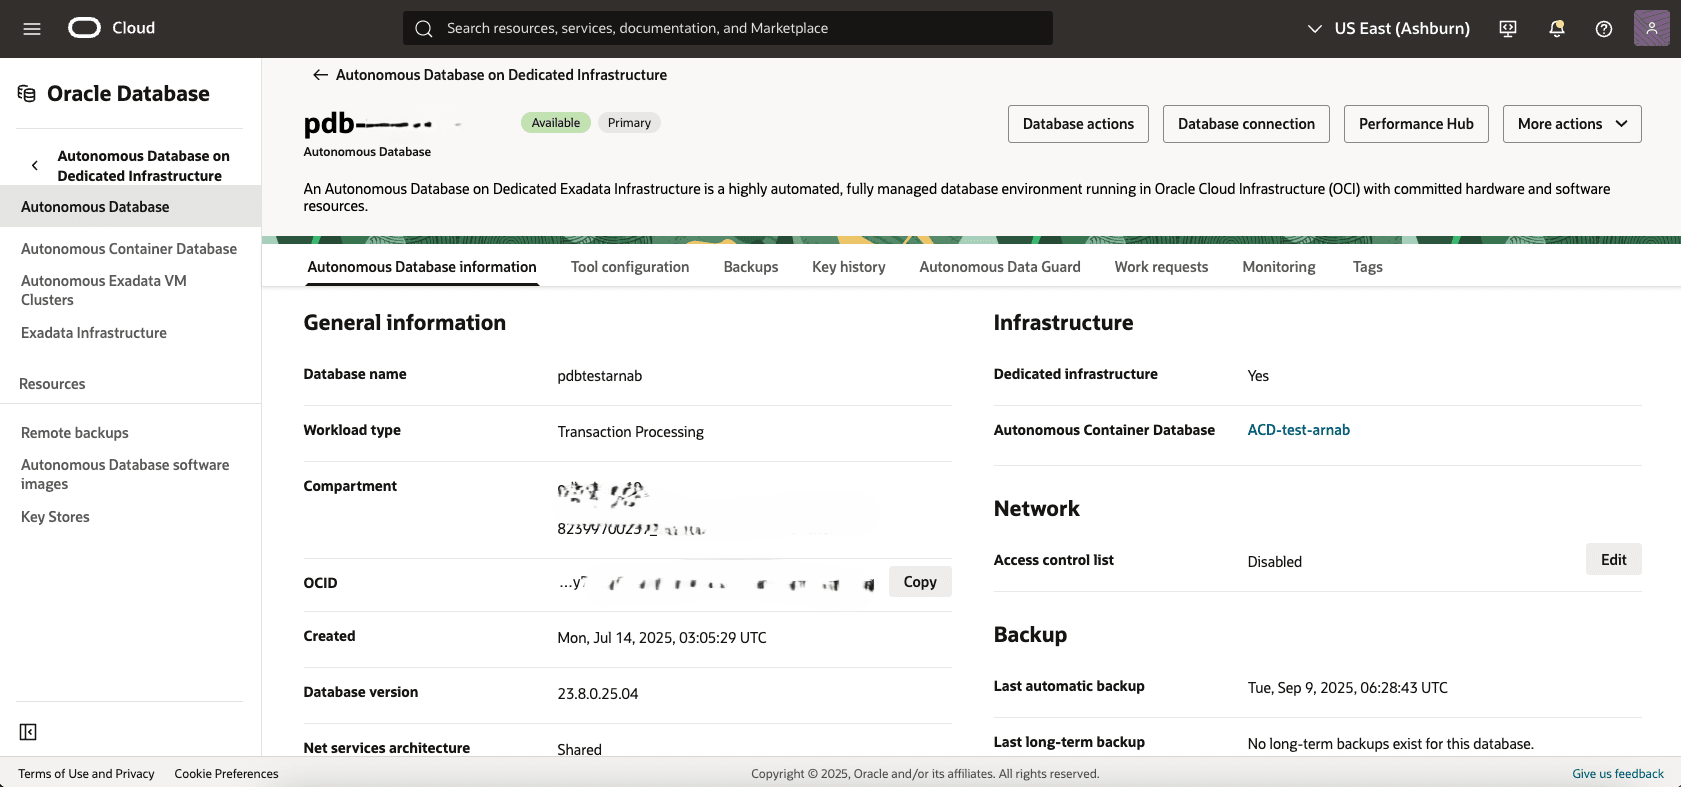
View the Autonomous AI Database Metrics- Form the AWS console, select CloudWatch.
- Select the region of your Autonomous VM Cluster.
- Expand the Metrics section, and then select the All metrics link.
- From the All metrics page, select ODB as Namespace.
- Paste the OCID or the Database name information that you previously obtained into the Search for any metric, dimension, resource id or account id field to start the search. The Metrics page will display the related results.
- You can select dimensions to view the respective metrics as listed below.

The following example displays the metrics related to transactions in Autonomous AI Database.

Table 1-5 Metrics for
Metric Description Units BlockChangesThe average number of blocks changed per second. (Statistic: Mean, Interval: 1 minute) Changes per second CPUTimeSecondsThe average rate of accumulation of CPU time by foreground sessions in the database instance over the time interval. The CPU time component of Average Active Sessions. (Statistic: Mean, Interval: 1 minute) Seconds per second CpuUtilizationThe CPU utilization expressed as a percentage, aggregated across all consumer groups. The utilization percentage is reported with respect to the number of CPUs the database is allowed to use, which is two times the number of OCPUs. (Statistic: Mean, Interval: 1 minute) Percent CurrentLogonsThe number of successful logons during the selected interval. (Statistics: Sum, Interval: 1 minute) Count DBTimeSecondsThe average rate of accumulation of database time (CPU + Wait) by foreground sessions in the database instance over the time interval. Also known as Average Active Sessions. (Statistic: Mean, Interval: 1 minute) Seconds per second ExecuteCountThe number of user and recursive calls that executed SQL statements during the selected interval. (Statistic: Sum, Interval: 1 minute) Count IOPSThe average number of input-output operations per second. (Statistic: Mean, Interval: 1 minute) Operations per second IOThroughputMBThe average throughput in MB per second. (Statistic: Mean, Interval: 1 minute) MB per second LogicalBlocksReadThe average number of blocks read from SGA/Memory (buffer cache) per second. (Statistic: Mean, Interval: 1 minute) Reads per second EcpusAllocatedThe actual number of ECPUs allocated by the service during the selected interval of time. (Statistic: Count, Interval: 1 minute) Integer ParseCountThe number of hard and soft parses during the selected interval. (Statistic: Sum, Interval: 1 minute) Count ParsesByTypeThe number of hard or soft parses per second. (Statistic: Mean, Interval: 1 minute) Parses per second RedoSizeMBThe average amount of redo generated, in MB per second. (Statistic: Mean, Interval: 1 minute) MB per second SessionsThe number of sessions in the database. (Statistic: Mean, Interval: 1 minute) Count StorageAllocatedThe maximum amount of space allocated by tablespace during the interval. For container databases, this metric provides data for root container tablespaces. (Statistic: Max, Interval: 30 minutes) GB StorageAllocatedByTablespaceThe maximum amount of space allocated by tablespace during the interval. For container databases, this metric provides data for root container tablespaces. (Statistic: Max, Interval: 30 minutes) GB StorageUsedThe maximum amount of space used during the interval. (Statistic: Max, Interval: 30 minutes) GB StorageUsedByTablespacehe maximum amount of space used by tablespace during the interval. For container databases, this metric provides data for root container tablespaces. (Statistic: Max, Interval: 30 minutes) GB StorageUtilizationThe percentage of provisioned storage capacity currently in use. Represents the total allocated space for all tablespaces. (Statistic: Mean, Interval: 30 minutes) Percent StorageUtilizationByTablespaceThe percentage of the space utilized, by tablespace. For container databases, this metric provides data for root container tablespaces. (Statistic: Mean, Interval: 30 minutes) Percent TransactionCountThe combined number of user commits and user rollbacks during the selected interval. (Statistic: Sum, Interval: 1 minute) Count TransactionsByStatusThe number of committed or rolled back transactions per second. (Statistic: Mean, Interval: 1 minute) Transactions per second UserCallsThe combined number of logons, parses, and execute calls during the selected interval. (Statistic: Sum, Interval: 1 minute) Count Pluggable Database Metrics
To view the Pluggable Database metrics, navigate to the OCI console and enable the Database management (Diagnostics & Management) to view the metrics. For more information, see Enable Database Management for a Pluggable Database.
Build Dashboards in CloudWatch
Amazon CloudWatch dashboards give you a unified and flexible way to monitor AWS resources, applications, and services in real time. You can bring together key metrics, logs, and alarms from multiple regions and accounts into a single view, helping you gain faster insights and improve operational visibility. With widgets like line charts, number panels, and gauges, you can easily track system health, spot performance trends, and monitor resource utilization. You can design dashboards tailored to their work-flows, correlate data across services, and act quickly on issues making CloudWatch dashboards a key tool for ensuring high availability and smooth operations in any cloud environment.
You can build dashboards from the CloudWatch console or programmatically using the PutDashboard API (via CLI or SDK). The API takes a JSON string describing your dashboard’s layout and widgets. You can even reuse the JSON from an existing dashboard to create a new one. For more information, see PutDashboard in the CloudWatch API reference.
Create a Dashboard from the AWS Console
- From the AWS console, select CloudWatch.
- From the left menu, select Dashboards , and then select the Create dashboard button.
- Enter a Dashboard name in the field, and then select the Create dashboard button.
- From the Add widget page, choose your Widget type.
- Graph (Line/Stacked area): Select Configure and then select one or more metrics in the Add metric graph dialog. Select the Create widget.
- If a metric isn’t listed (for example, if there is no data from the last 14 days), you can manually add it. For more information, see Graph metrics manually on a CloudWatch dashboard.
- Graph (Line/Stacked area): Select Configure and then select one or more metrics in the Add metric graph dialog. Select the Create widget.
- Choose Add widget, and repeat the step 4 to add more widgets. You can add as many as metrics you want.
- For any graph, click the info icon to see metric descriptions.
- Click on the Save dashboard button to save your changes.
For example, a custom dashboard is created using the metrics of two virtual machines in an Exadata VM Cluster. This dashboard displays a comparative analysis of metrics such as CPU Utilization, SWAP Utilization, Memory Utilization, and Load Average for the two VMs in the cluster.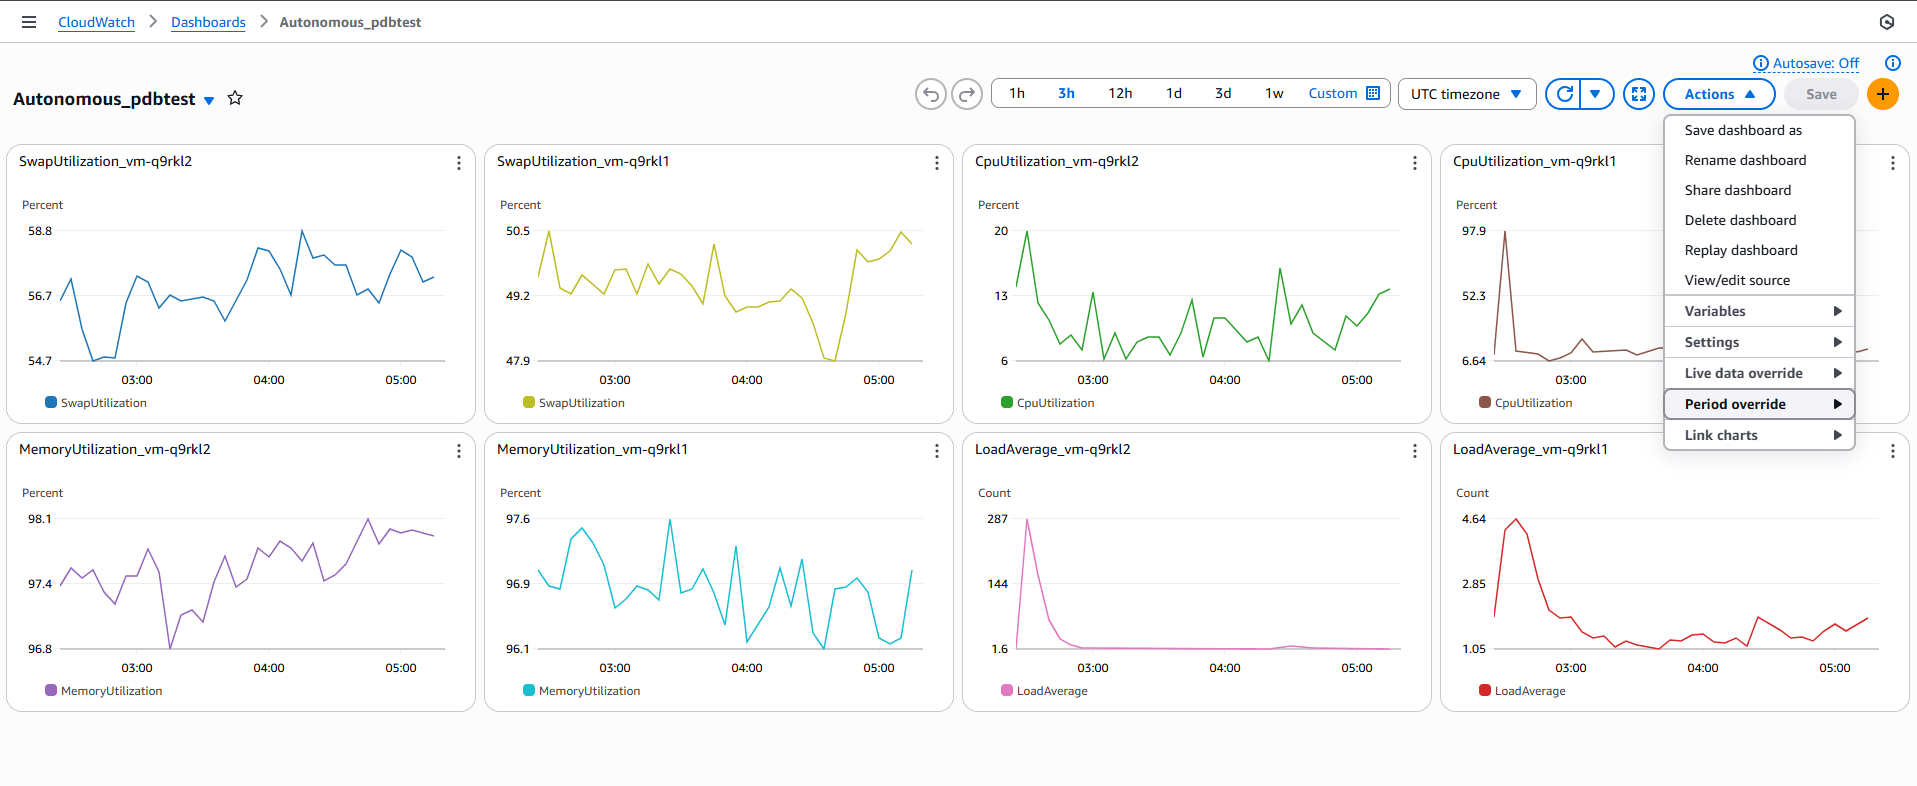
CloudWatch Alarm
This topic explains how to set up alarms to monitor metrics that will notify you or automatically adjust the monitored resources whenever a threshold is exceeded.
A metric alarm monitors a single CloudWatch metric or the result of a mathematical expression based on CloudWatch metrics. It triggers one or more actions when the monitored metric or expression breaches a specified threshold over a set number of evaluation periods. These actions include sending notifications through Amazon Simple Notification Service (SNS) , executing Amazon EC2 or Auto Scaling actions, or creating OpsItems or incidents in AWS Systems Manager.
In this following example, you will create an Amazon SNS topic to enable notifications by email and text message. Create a topic named AutonomousMonitor and subscribe your work email address to receive notifications. This SNS topic will also be used later when configuring CloudWatch alarms.
- Create an Amazon SNS topic by running the following command:
aws sns create-topic --name <Name of the SNS topic> - Subscribe to the topic, then specify the email protocol and the email address for the notification endpoint by running the following command:
aws sns subscribe --topic-arn <ARN of the SNS topic created> --protocol email --notification-endpoint <Email ID> - Confirm the subscription before the email address can start receiving messages.
- Check your email and choose Confirm subscription in the email you receive from Amazon SNS.
- Amazon SNS automatically opens your web browser and displays a subscription confirmation with your subscription ID.

- Check the status of the subscription. It will return 1 if the status is Confirmed.
aws sns get-topic-attributes \ --topic-arn < ARN of the topic > \ --query 'Attributes.SubscriptionsConfirmed' \ --output text - Now, you can create a CloudWatch alarm on any of the dashboard widgets. Collect the metrics from the three namespaces—AWS/ODB. You can use the following query to identify the available metrics in each namespaces:
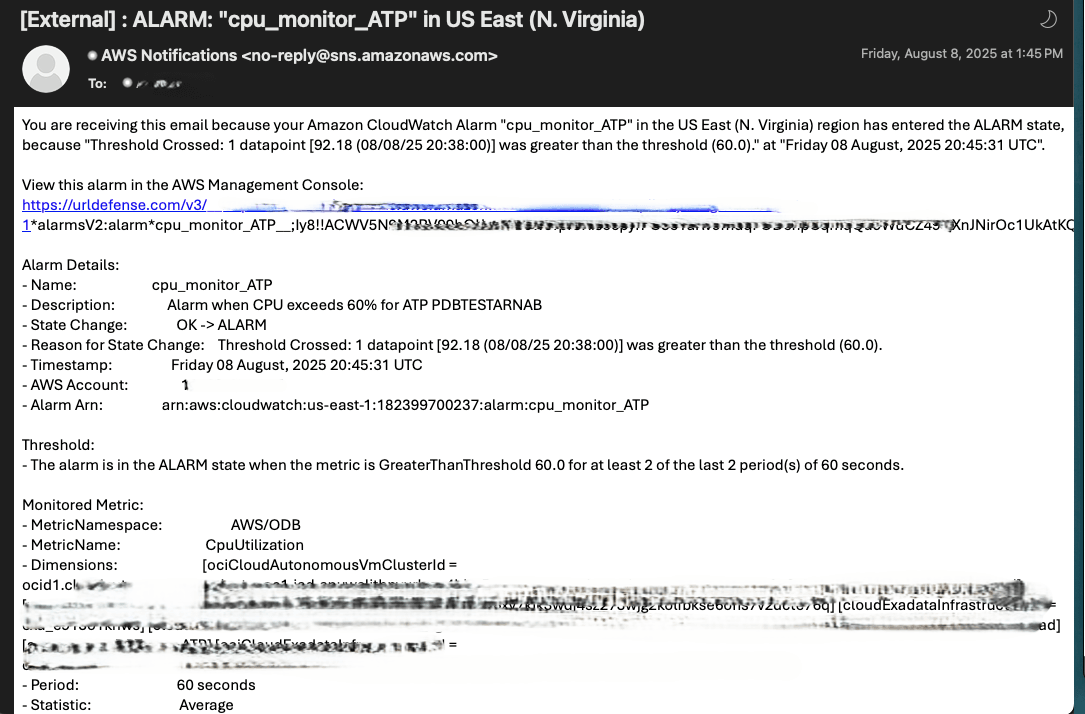
aws cloudwatch list-metrics --namespace "AWS/ODB" - Choose any metric and use the following code to create a CloudWatch alarm. Be sure to specify the correct namespace, dimensions, and metric name. The example below demonstrates how to creatw an alarm for high CPU utilization when a database exceeds 60 percent.
aws cloudwatch put-metric-alarm \

  --alarm-name cpu_monitor_ATP \

  --alarm-description "Alarm when CPU exceeds 60% for ATP PDBTESTARNAB" \

  --metric-name CpuUtilization \

  --namespace AWS/ODB \

  --statistic Average \

  --period 60 \

  --threshold 60 \

  --comparison-operator GreaterThanThreshold \

  --dimensions Name=ociCloudAutonomousVmClusterId,Value=ocid1.cloudautonomousvmcluster.oc1.iad.anuwcljtbpyurlyac4bbp52ehggvqadbtsjeqwuiqcgah4i6mndr6swd6u2a \

               Name=deploymentType,Value=Dedicated \

               Name=resourceId,Value=ocid1.autonomousdatabase.oc1.iad.anuwcljtbpyurlyai6xy7kik3wdj4sz273wjg2kolfbkse6ons7v2dcte76q \

               Name=cloudExadataInfrastructureId,Value=exa_e913o1khws \

               Name=cloudAutonomousVmClusterId,Value=avmc_xgzshl9ela \

               Name=displayName,Value="CPU Utilization" \

               Name=resourceName,Value=PDBTESTARNAB \

               Name=region,Value=iad \

               Name=autonomousDBType,Value=ATP \

               Name=ociCloudExadataInfrastructureId,Value=ocid1.cloudexadatainfrastructure.oc1.iad.anuwcljtbpyurlyazqzf3ggqwaydvu32l34izfzm4a4vnsay7b67iaedza6a \

  --evaluation-periods 2 \

  --alarm-actions arn:aws:sns:us-east-1:182399700237:AutonomousMonitor
- The following screenshot shows the email that you will receive.
