Security Monitoring Solution
The Security monitoring solution in Oracle Log Analytics is a set of curated dashboards that help you monitor and understand the security posture of your cloud resources.
The Security monitoring solution turns complex log data into actionable insights, helping you quickly spot, investigate, and address security issues in your cloud environment. It’s designed to save you time, reduce risk, and improve your overall security posture by making Oracle Log Analytics straightforward and relevant for key cloud assets.
-
Comprehensive Visibility Across Layers:
- Focuses on network layer activities, highlighting traffic anomalies, threat IP locations, port scanning, data transfer spikes, and denied connections. This helps detect early signs of network-based attacks, such as scans or unauthorized data transfer.
- Zooms into the server and system layer, monitoring failed logins, privilege escalations, and account access attempts. Suspicious patterns here often indicate attempted break-ins, escalation, or compromised accounts on hosts.
- Provides a governance and control perspective by auditing user actions, API calls, resource modifications, and login attempts system-wide. This is crucial for tracking who did what, when, and where across all Oracle cloud services.
-
Correlating Incidents Across Domains: A single abnormality (for example, a spike in denied connections or a failed login storm) in one layer may not present a complete picture. Together, these dashboards let you compile the events:
- A threat IP detected in VCN traffic, followed by failed SSH logins in Compute, and odd API actions in the Audit log, could point to a coordinated breach attempt.
- This correlation helps in rapid root cause analysis, enabling faster containment and remediation.
-
Compliance, Forensics, and Continuous Monitoring:
- Audit dashboards ensure regulatory compliance with actionable logs of all critical changes and access events.
- Compute and VCN dashboards offer real-time and historical insights, helping with post-event forensics and ongoing anomaly detection.
-
Proactive and Reactive Security:
- Proactive: Quickly spot and resolve incorrect configurations, unauthorized access, or exposed services before they’re exploited.
- Reactive: Rapidly investigate alerts or incidents by pivoting between dashboards, from network spikes to login anomalies to specific API or resource changes.
-
Empowering Different Teams:
- Security Operations: Benefit from consolidated, actionable threat intelligence for enterprise-wide cloud monitoring.
- Cloud/Network Admins: Gain visibility into both infrastructure and access patterns, so they can harden vulnerable surfaces.
- Compliance and Governance: Confidently demonstrate control over critical assets and monitor for policy violations.
Ingest Security-related OCI Logs
The Add Data wizard available in the Administration page of Log Analytics offers a ready interface to ingest logs through any of the following methods. Click Add Data on the Administration Overview page, expand the corresponding section in the Add Data page, and follow the guidelines in the wizard to ingest the logs. For more details about each of these ingestion methods, the required IAM policies, and step-by-step instructions to ingest logs without the wizard, follow the corresponding links below:
-
For Virtual Cloud Network logs, click Monitor OCI resources in the Add Data page. The Configure log collection for OCI resources page opens. Specify the OCI resource Virtual Cloud Network - Flowlogs and follow the prompts to complete the set up. See Ingest Logs from Other OCI Services Using Service Connector.
The log group logging_analytics_automatic_discovery_source for OCI Logging service will be created or updated for collecting logs in Log Analytics by using Service Connector.
-
For Compute logs, expand Monitor with management agent in the Add Data page. Click Configure Agent. The Set Up Ingestion dialog box opens where the IAM policy is created and the required resources are created. Install the management agent. Ensure to deploy the Logging Analytics plug-in when installing the agent. See Tutorial: Set Up Continuous Log Collection for more details about setting up ingestion using management agent.
Under Monitor with management agent, click Linux Core Logs. The Configure agent-based log collection page opens. This selection already has the security related host logs available for selection.
-
For OCI Audit logs, click Security and Compliance, and select OCI Audit Logs in the Add Data page. Select or create the Service Connector and the Log Group Compartment for collecting logs into Log Analytics. Follow the prompts to complete the set up. See Ingest Logs from Other OCI Services Using Service Connector.
When using Add Data wizard, you must be a member of the Administrators group with access to root compartment if you want to ingest logs using any of the following methods:
- Monitor OCI resources
- Monitor with management agent: Only if you must also configure the management agent
- Monitor Kubernetes (recommended)
- Security and Compliance
See The Administrators Group, Policy, and Administrator Roles.
For an example walk through of the steps to ingest OCI service logs using Add Data wizard, watch Video: How to Quickly Ingest Logs into Log Analytics from Other OCI Services![]() in Oracle Cloud Observability and Management Platform.
in Oracle Cloud Observability and Management Platform.
Monitor Your OCI Security Posture
The following dashboards in the Security Monitoring Solution give Oracle Cloud Infrastructure users a 360-degree view of their cloud environment’s security, spanning network, compute, and control planes. This layered, correlated, and visual approach enables faster threat detection, easier forensic investigations, better compliance, and strengthened security posture for Oracle Cloud workloads.
To view the solution for your security posture, open the navigation menu and click Observability & Management. Under Log Analytics, click Solutions, and click Security. The Security Monitoring Solution page opens.
The three Oracle-defined views Virtual Cloud Network, Compute, and OCI Audit are displayed in the Security Monitoring Solution page. You can now explore the solution and the views available to analyze further.
In the dashboard, you can use the following options for any of the widgets:
- Click the Open
 icon on a widget to open the widget in the Log Explorer.
- Click the Actions
 in the top right corner of the widget, click Maximize to view the widget in large size right inside the dashboard page.
- Click the Actions
 in the top right corner of the widget, click Export to CSV to export the analysis values to a comma separated values (CSV) file.
-
Click the View Query icon
 in the bottom right corner of the widget to view the query that is used for filtering the logs and generating the analysis. The View Query dialog box opens. Here you can Copy query text or Cope query URL.
Virtual Cloud Network
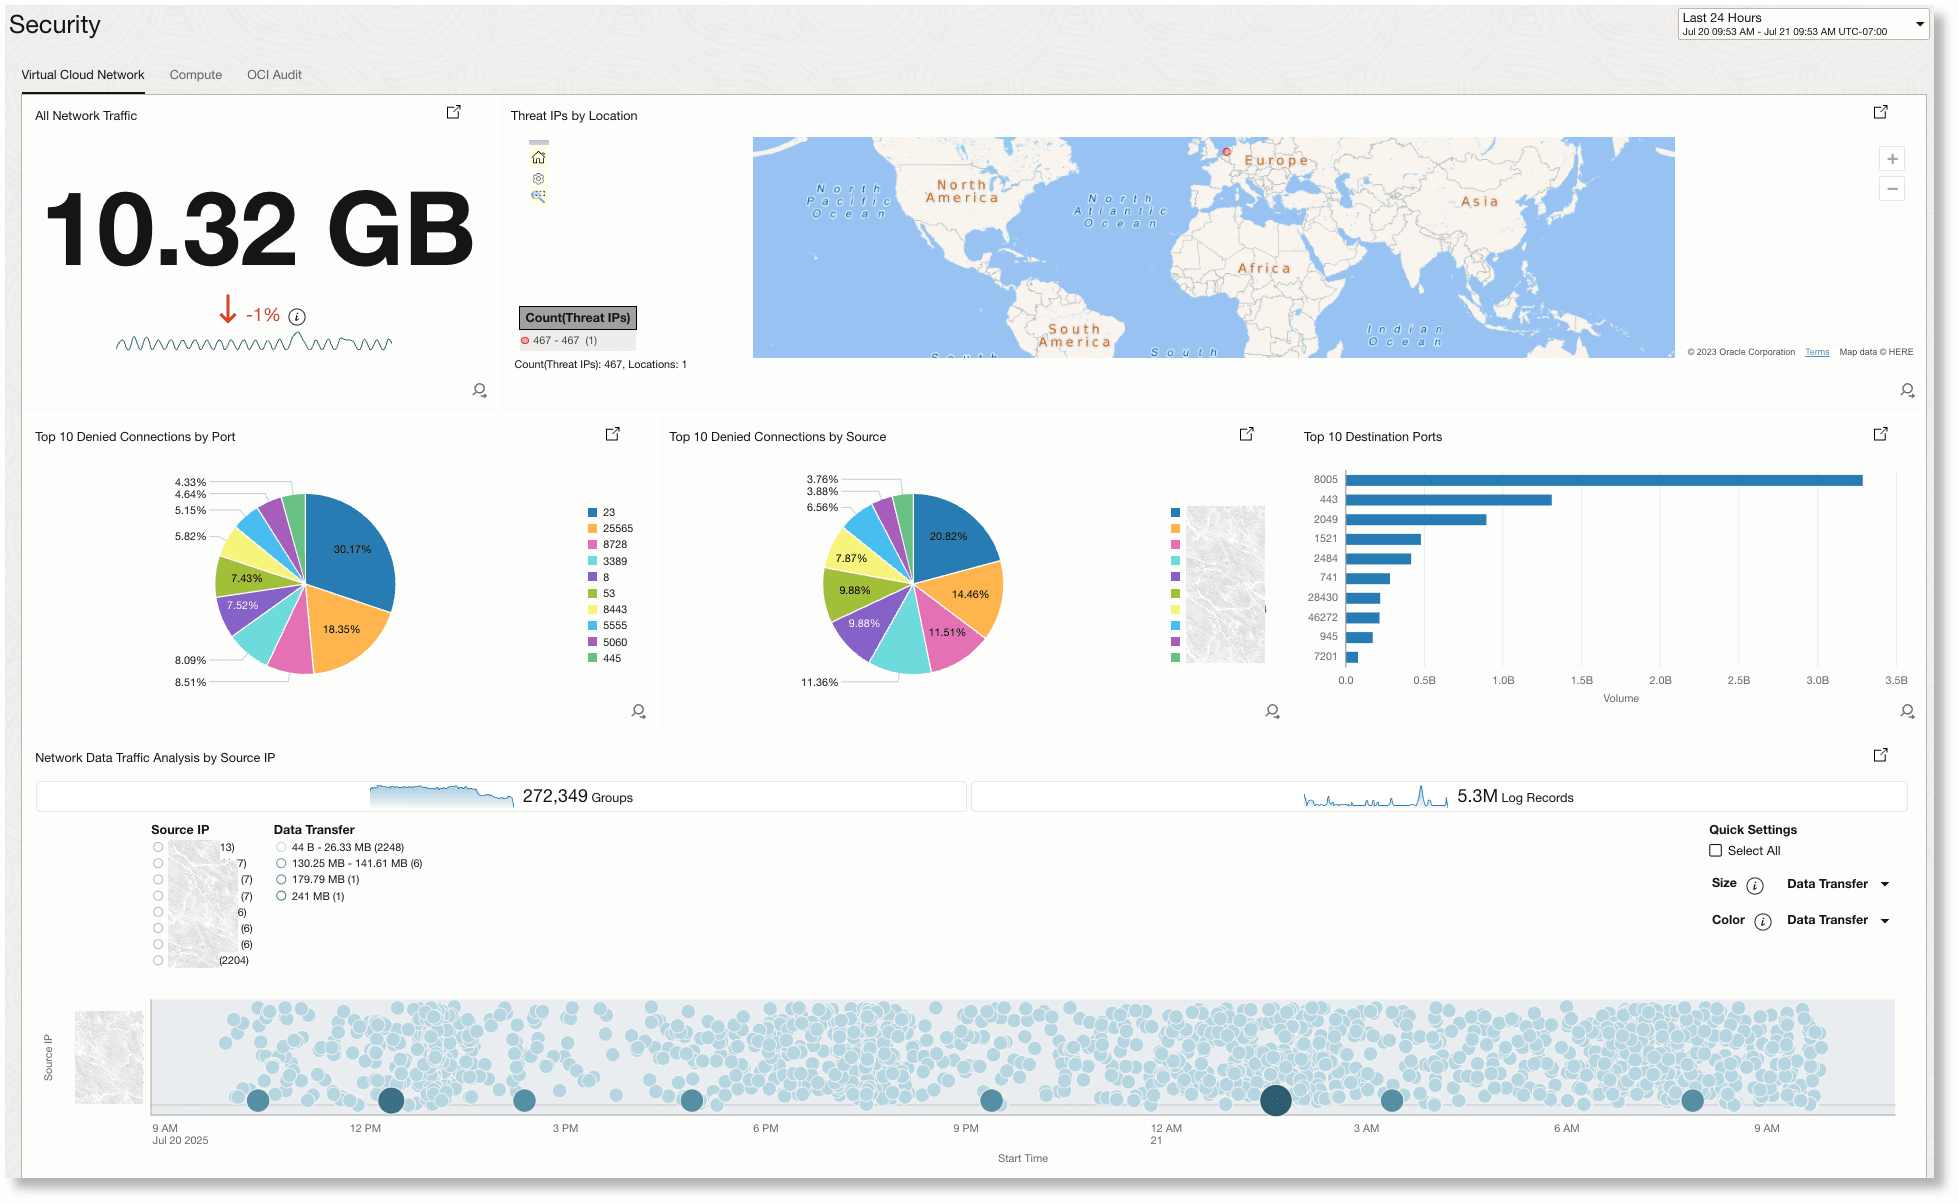
This dashboard transforms raw VCN logs into actionable insights, giving security, network, and cloud teams the power to quickly detect, investigate, and respond to threats within their Oracle Cloud environment. It performs threat evaluation on client IP addresses to find those with bad reputation.
The following image is an example Virtual Cloud Network dashboard/view:

The Virtual Cloud Network dashboard has the following widgets:
-
All Network Traffic:
Provides an at-a-glance overview of the total network traffic volume (in GB) over the selected time period, along with a percentage trend. This helps you quickly assess significant increases or decreases in overall data flow, which could indicate shifts in activity or potential security events.
-
Threat IPs by Location:
Displays the geographic origin of threat IPs detected on your network using a world map visualization. This allows you to identify if suspicious activity is concentrated in specific regions, which can help with threat attribution or geo-based access blocking.
-
Top 10 Denied Connections by Port:
Shows a breakdown of the ports that are being most frequently targeted with denied connection attempts. Understanding which ports face the highest risk lets you focus on reinforcing security controls where they are needed most.
-
Top 10 Denied Connections by Source:
Highlights the source IP addresses that are generating the most denied connection attempts, visualized as a pie chart. This helps you quickly identify persistent offenders or potentially compromised hosts targeting your network.
-
Top 10 Destination Ports:
Lists the most popular destination ports in terms of traffic volume, helping pinpoint which services and protocols are most accessed. This is valuable for validating expected traffic patterns and spotting abnormal access trends that could signal an attack.
-
Network Data Traffic Analysis by Source IP:
Provides a detailed, time-based visualization of network data transfers broken down by source IP, including bubble and bar charts for volume and log record activity. This widget enables rapid detection of data spikes, traffic anomalies, or unusual source behaviors requiring further investigation.
Together, these widgets give you end-to-end visibility for spotting, investigating, and responding to VCN-related security events.
Compute
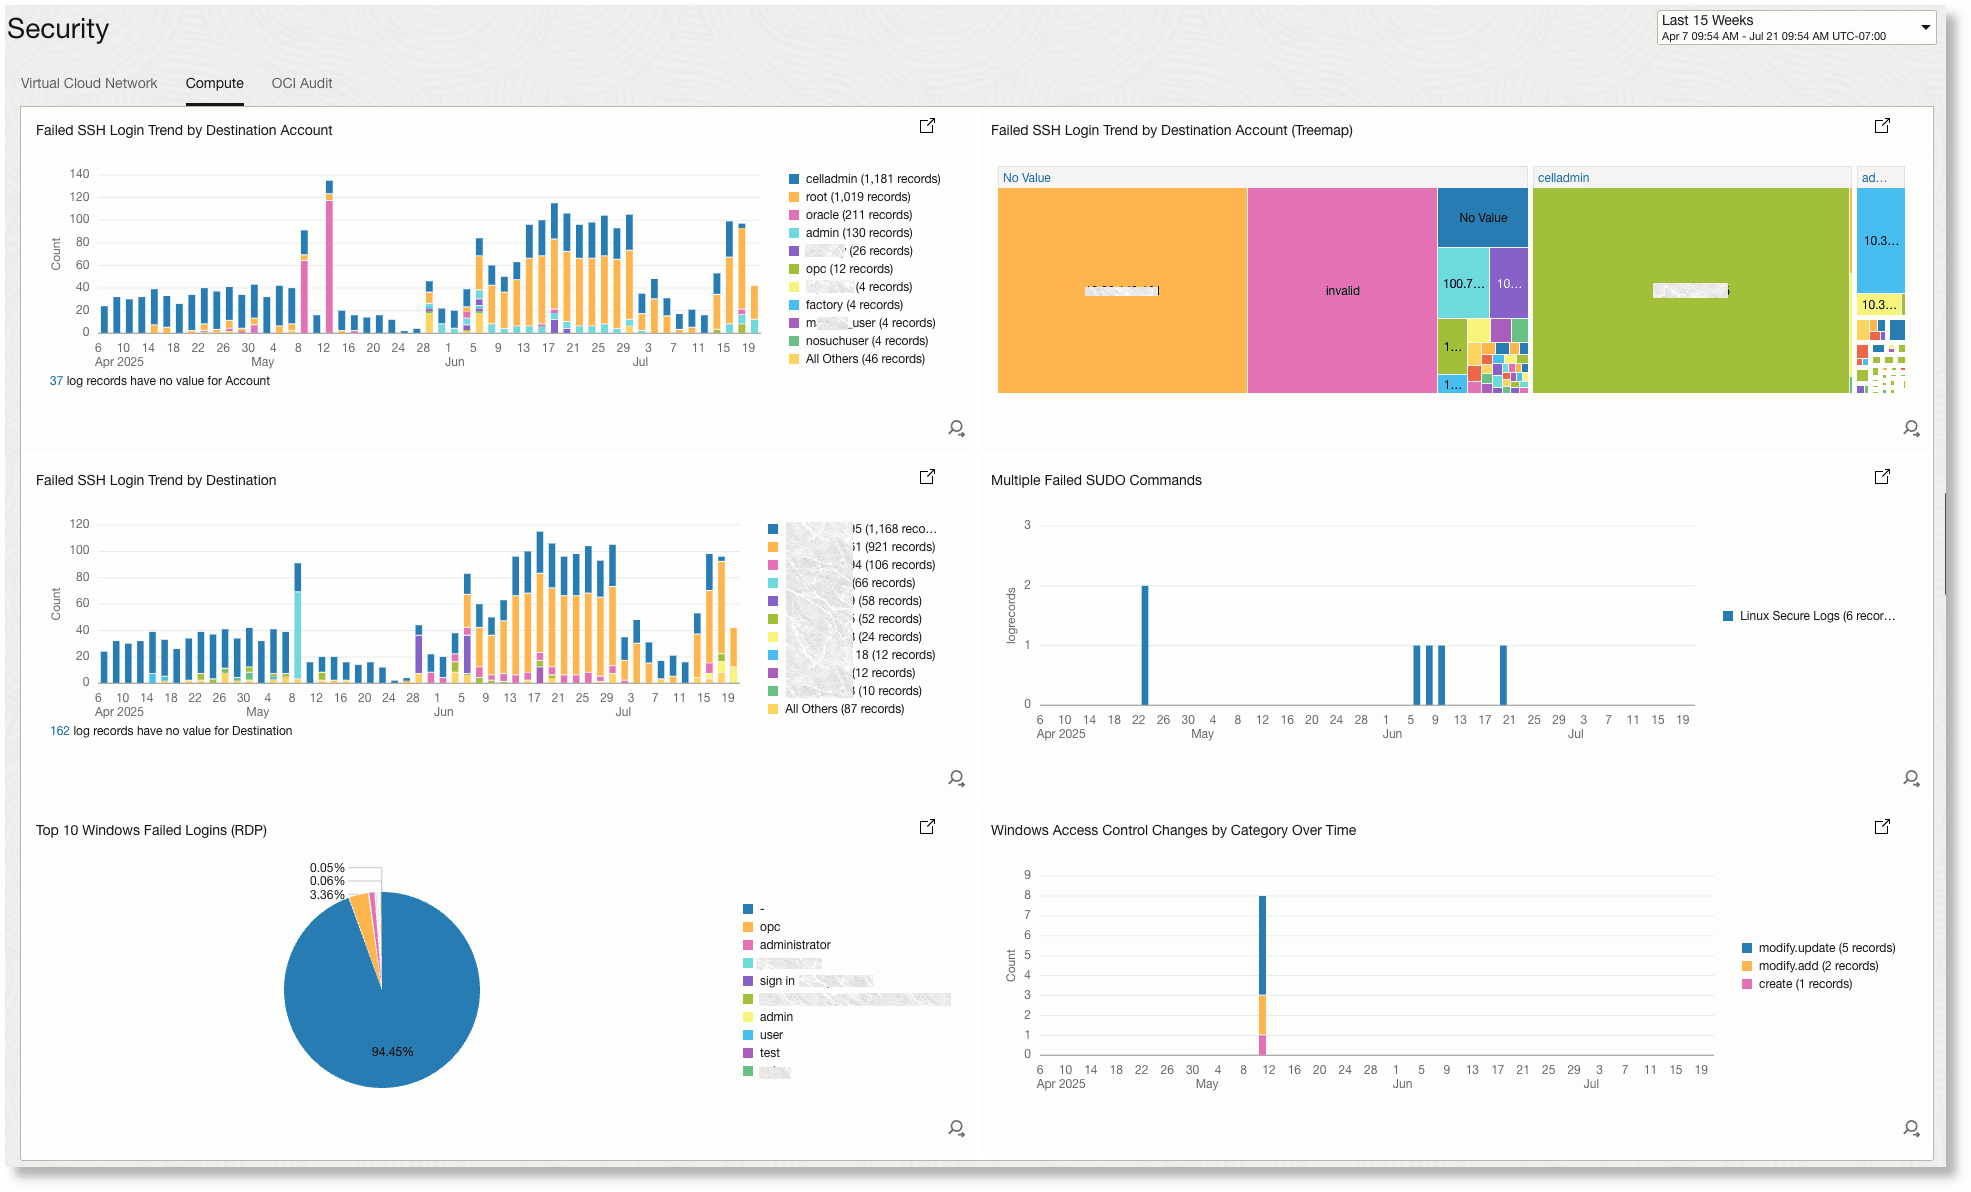
The widgets in this dashboard/view collectively provide deep visibility into access-related activities across compute resources.
By tracking failed login attempts for both Linux (SSH) and Windows (RDP), as well as monitoring for sudo command abuse and access control changes, the dashboard enables teams to:
- Identify and investigate brute-force or targeted attack attempts.
- Detect privilege escalation efforts or policy tampering.
- Correlate activity across user accounts and compute instances to quickly zero in on suspicious patterns. This comprehensive view empowers security teams and administrators to proactively detect, investigate, and respond to threats before they escalate, strengthening the security posture of the compute environment.
The following image is an example Compute dashboard/view:

The following widgets are displayed in your Compute dashboard/view:
-
Failed SSH Login Trend by Destination Account:
This bar chart displays trends in failed SSH login attempts over time, grouped by the targeted account. It helps identify which user accounts are being targeted most frequently by unauthorized login attempts and spot brute-force attacks.
-
Failed SSH Login Trend by Destination Account:
The treemap visualizes the distribution of failed SSH logins across different destination accounts, providing a quick, comprehensive view of which accounts are most vulnerable or frequently attacked within the environment.
-
Failed SSH Login Trend by Destination:
This bar chart tracks failed SSH login attempts by destination server IP over time. It enables rapid identification of specific compute instances that are under attack or experiencing abnormal login activity.
-
Multiple Failed SUDO Commands:
This widget is designed to highlight users or sessions where multiple failed sudo command attempts occurred, which can indicate privilege escalation attempts or incorrect configurations.
-
Top 10 Windows Failed Logins (RDP):
Displays the most frequent failed Remote Desktop Protocol login attempts on Windows servers, which is useful for identifying possible brute-force attacks on Windows-based compute resources.
-
Windows Access Control Changes by Category Over Time:
Shows trends in access control changes on Windows systems, categorized for easier analysis. This helps in spotting unauthorized access adjustments or monitoring for compliance.
OCI Audit
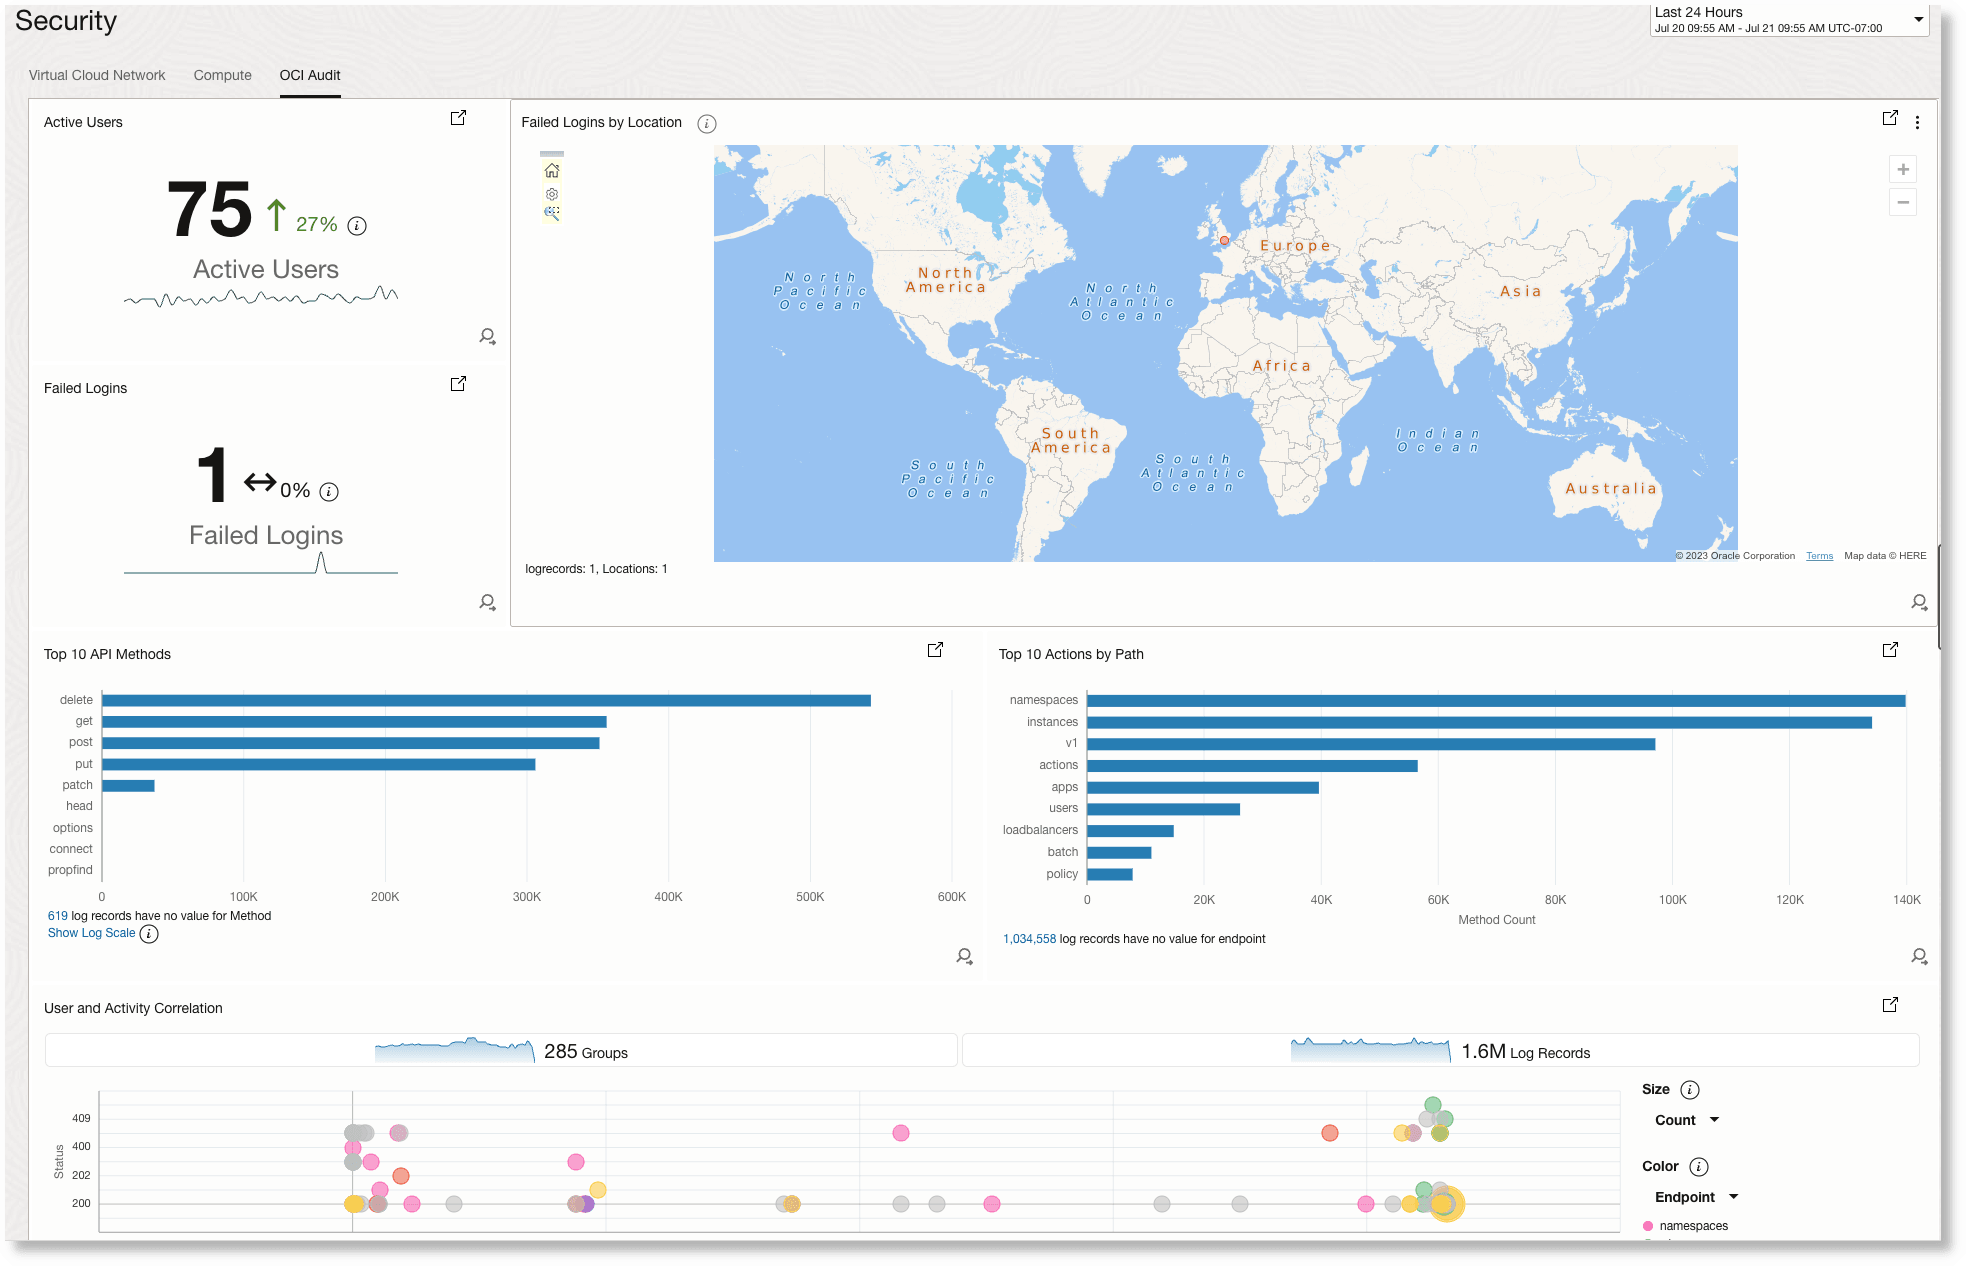
This dashboard provide visibility into user actions, authentication attempts, and API activity across your OCI tenancy. It helps you to proactively identify, investigate, and respond to security incidents within OCI, helping maintain compliance and minimize risk. It performs threat evaluation on client IP addresses to find those with bad reputation.
The following image is an example OCI Audit dashboard/view:

The following widgets are displayed in your OCI Audit dashboard/view:
-
Active Users:
Shows the current number of users performing actions in the environment, along with a trend indicator. This helps administrators quickly gauge overall activity, and spot unusual spikes or drops in user engagement.
-
Failed Logins:
Displays the count of failed login attempts in the selected period. With accompanying trend lines, this widget helps in spotting any rise in authentication failures that could indicate brute-force attempts or credential misuse.
-
Failed Logins by Location:
Intended to show the geographic origin of failed logins, highlighting suspicious attempts from unexpected regions. This view is crucial for identifying location-based attack patterns.
-
Top 10 API Methods:
Lists the most frequently used API methods, giving insight into the types of operations being executed most often. Reviewing this helps spot potentially risky activities, such as a spike in modification (PUT/POST) operations.
-
Top 10 Actions by Path:
Displays the most common resource paths accessed or modified in the environment. This widget helps identify which areas of the infrastructure are most frequently targeted, supporting the detection of abnormal or unauthorized changes.
-
User and Activity Correlation:
Visualizes users and their associated activities over time, with bubble size and color denoting activity level and endpoint type. This correlation is useful for rapidly spotting anomalous behaviors or high-risk user actions that deviate from the norm.
Allow All Security Monitoring Operations
The following IAM policies are created when you use Add Data wizard to ingest logs. Verify that the IAM policies are created.
- Virtual Cloud Network: The IAM policy logging_analytics_automatic_oci_discovery_policies with the following policy statements will be created or updated.
allow resource loganalyticsvrp LogAnalyticsVirtualResource to {VCN_READ, SUBNET_READ, VNIC_READ} in tenancy allow any-user to {LOG_ANALYTICS_LOG_GROUP_UPLOAD_LOGS} in compartment id <Compartment_OCID> where all {request.principal.type='serviceconnector', target.loganalytics-log-group.id='<target_log_group_OCID>', request.principal.compartment.id='<compartment_OCID'} - Compute: The IAM policy logging_analytics_automatic_ingestion_policies will be created with the following statements.
allow DYNAMIC-GROUP logging_analytics_agent to {LOG_ANALYTICS_LOG_GROUP_UPLOAD_LOGS} in tenancy allow DYNAMIC-GROUP logging_analytics_agent to read USERS in tenancy - OCI Audit: The IAM policy logging_analytics_automatic_ingestion_policies with the following policy statements will be created or updated.
allow resource loganalyticsvrp LogAnalyticsVirtualResource to {EVENTRULE_READ} in tenancy
allow resource loganalyticsvrp LogAnalyticsVirtualResource to {LOAD_BALANCER_READ} in tenancy
allow resource loganalyticsvrp LogAnalyticsVirtualResource to {BUCKET_READ} in tenancy
allow resource loganalyticsvrp LogAnalyticsVirtualResource to read functions-family in tenancy
allow resource loganalyticsvrp LogAnalyticsVirtualResource to read api-gateway-family in tenancy
allow resource loganalyticsvrp LogAnalyticsVirtualResource to {VCN_READ, SUBNET_READ, VNIC_READ} in tenancy
allow resource loganalyticsvrp LogAnalyticsVirtualResource to {APPROVED_SENDER_READ} in tenancy
allow resource loganalyticsvrp LogAnalyticsVirtualResource to {IPSEC_CONNECTION_READ} in tenancy
allow resource loganalyticsvrp LogAnalyticsVirtualResource to {WEB_APP_FIREWALL_READ} in tenancy
allow resource loganalyticsvrp LogAnalyticsVirtualResource to read operator-control-family in tenancy
allow resource loganalyticsvrp LogAnalyticsVirtualResource to {NETWORK_FIREWALL_READ} in tenancy
allow resource loganalyticsvrp LogAnalyticsVirtualResource to {DEVOPS_DEPLOYMENT_READ} in tenancy
allow resource loganalyticsvrp LogAnalyticsVirtualResource to {DEVOPS_DEPLOY_PIPELINE_READ} in tenancy
allow resource loganalyticsvrp LogAnalyticsVirtualResource to {DEVOPS_DEPLOY_STAGE_READ} in tenancy
allow resource loganalyticsvrp LogAnalyticsVirtualResource to {APM_DOMAIN_READ} in tenancy
allow resource loganalyticsvrp LogAnalyticsVirtualResource to {SERVICE_CONNECTOR_READ} in tenancy
allow resource loganalyticsvrp LogAnalyticsVirtualResource to {DATAFLOW_APPLICATION_READ} in tenancy
allow resource loganalyticsvrp LogAnalyticsVirtualResource to {MEDIA_WORKFLOW_READ} in tenancy
allow resource loganalyticsvrp LogAnalyticsVirtualResource to {MEDIA_WORKFLOW_JOB_READ} in tenancy
allow resource loganalyticsvrp LogAnalyticsVirtualResource to {CLUSTER_READ} in tenancy
allow resource loganalyticsvrp LogAnalyticsVirtualResource to {GOLDENGATE_DEPLOYMENT_READ} in tenancy
allow resource loganalyticsvrp LogAnalyticsVirtualResource to {CG_DATA_SOURCE_READ} in tenancy
allow resource loganalyticsvrp LogAnalyticsVirtualResource to {POSTGRES_DB_SYSTEM_READ} in tenancy
allow any-user to {LOG_ANALYTICS_LOG_GROUP_UPLOAD_LOGS} in compartment id <compartment_OCID> where all {request.principal.type='serviceconnector', target.loganalytics-log-group.id='<target_log_group_OCID>', request.principal.compartment.id='<compartment_OCID>'}