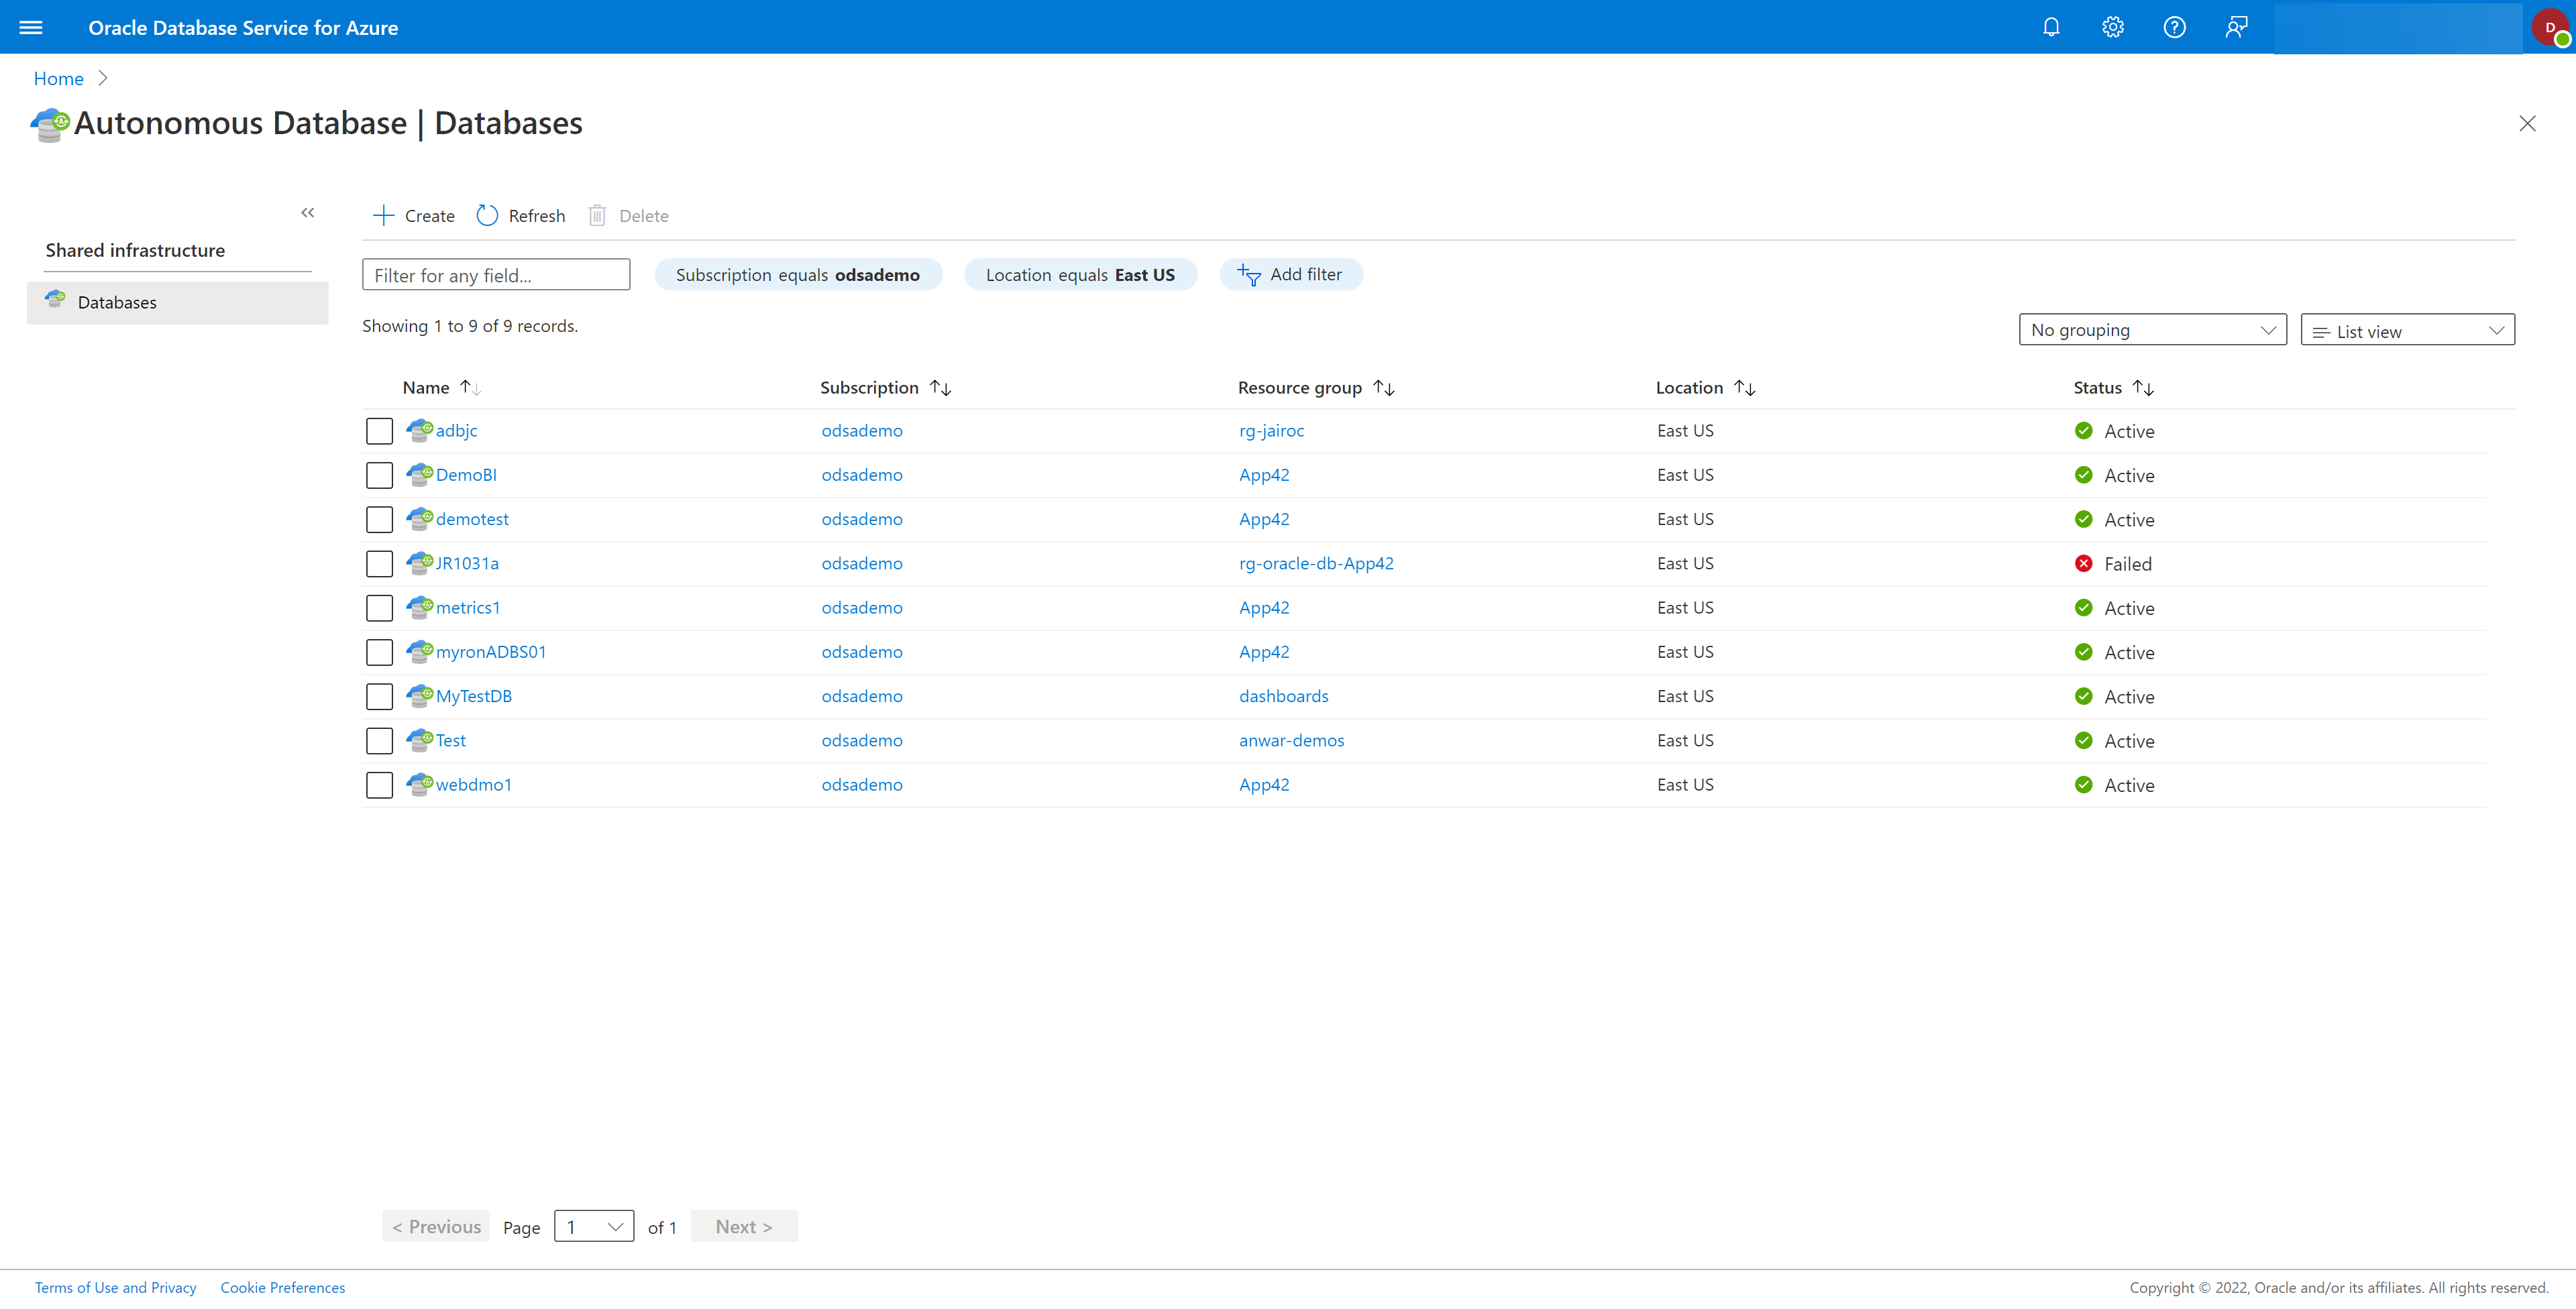
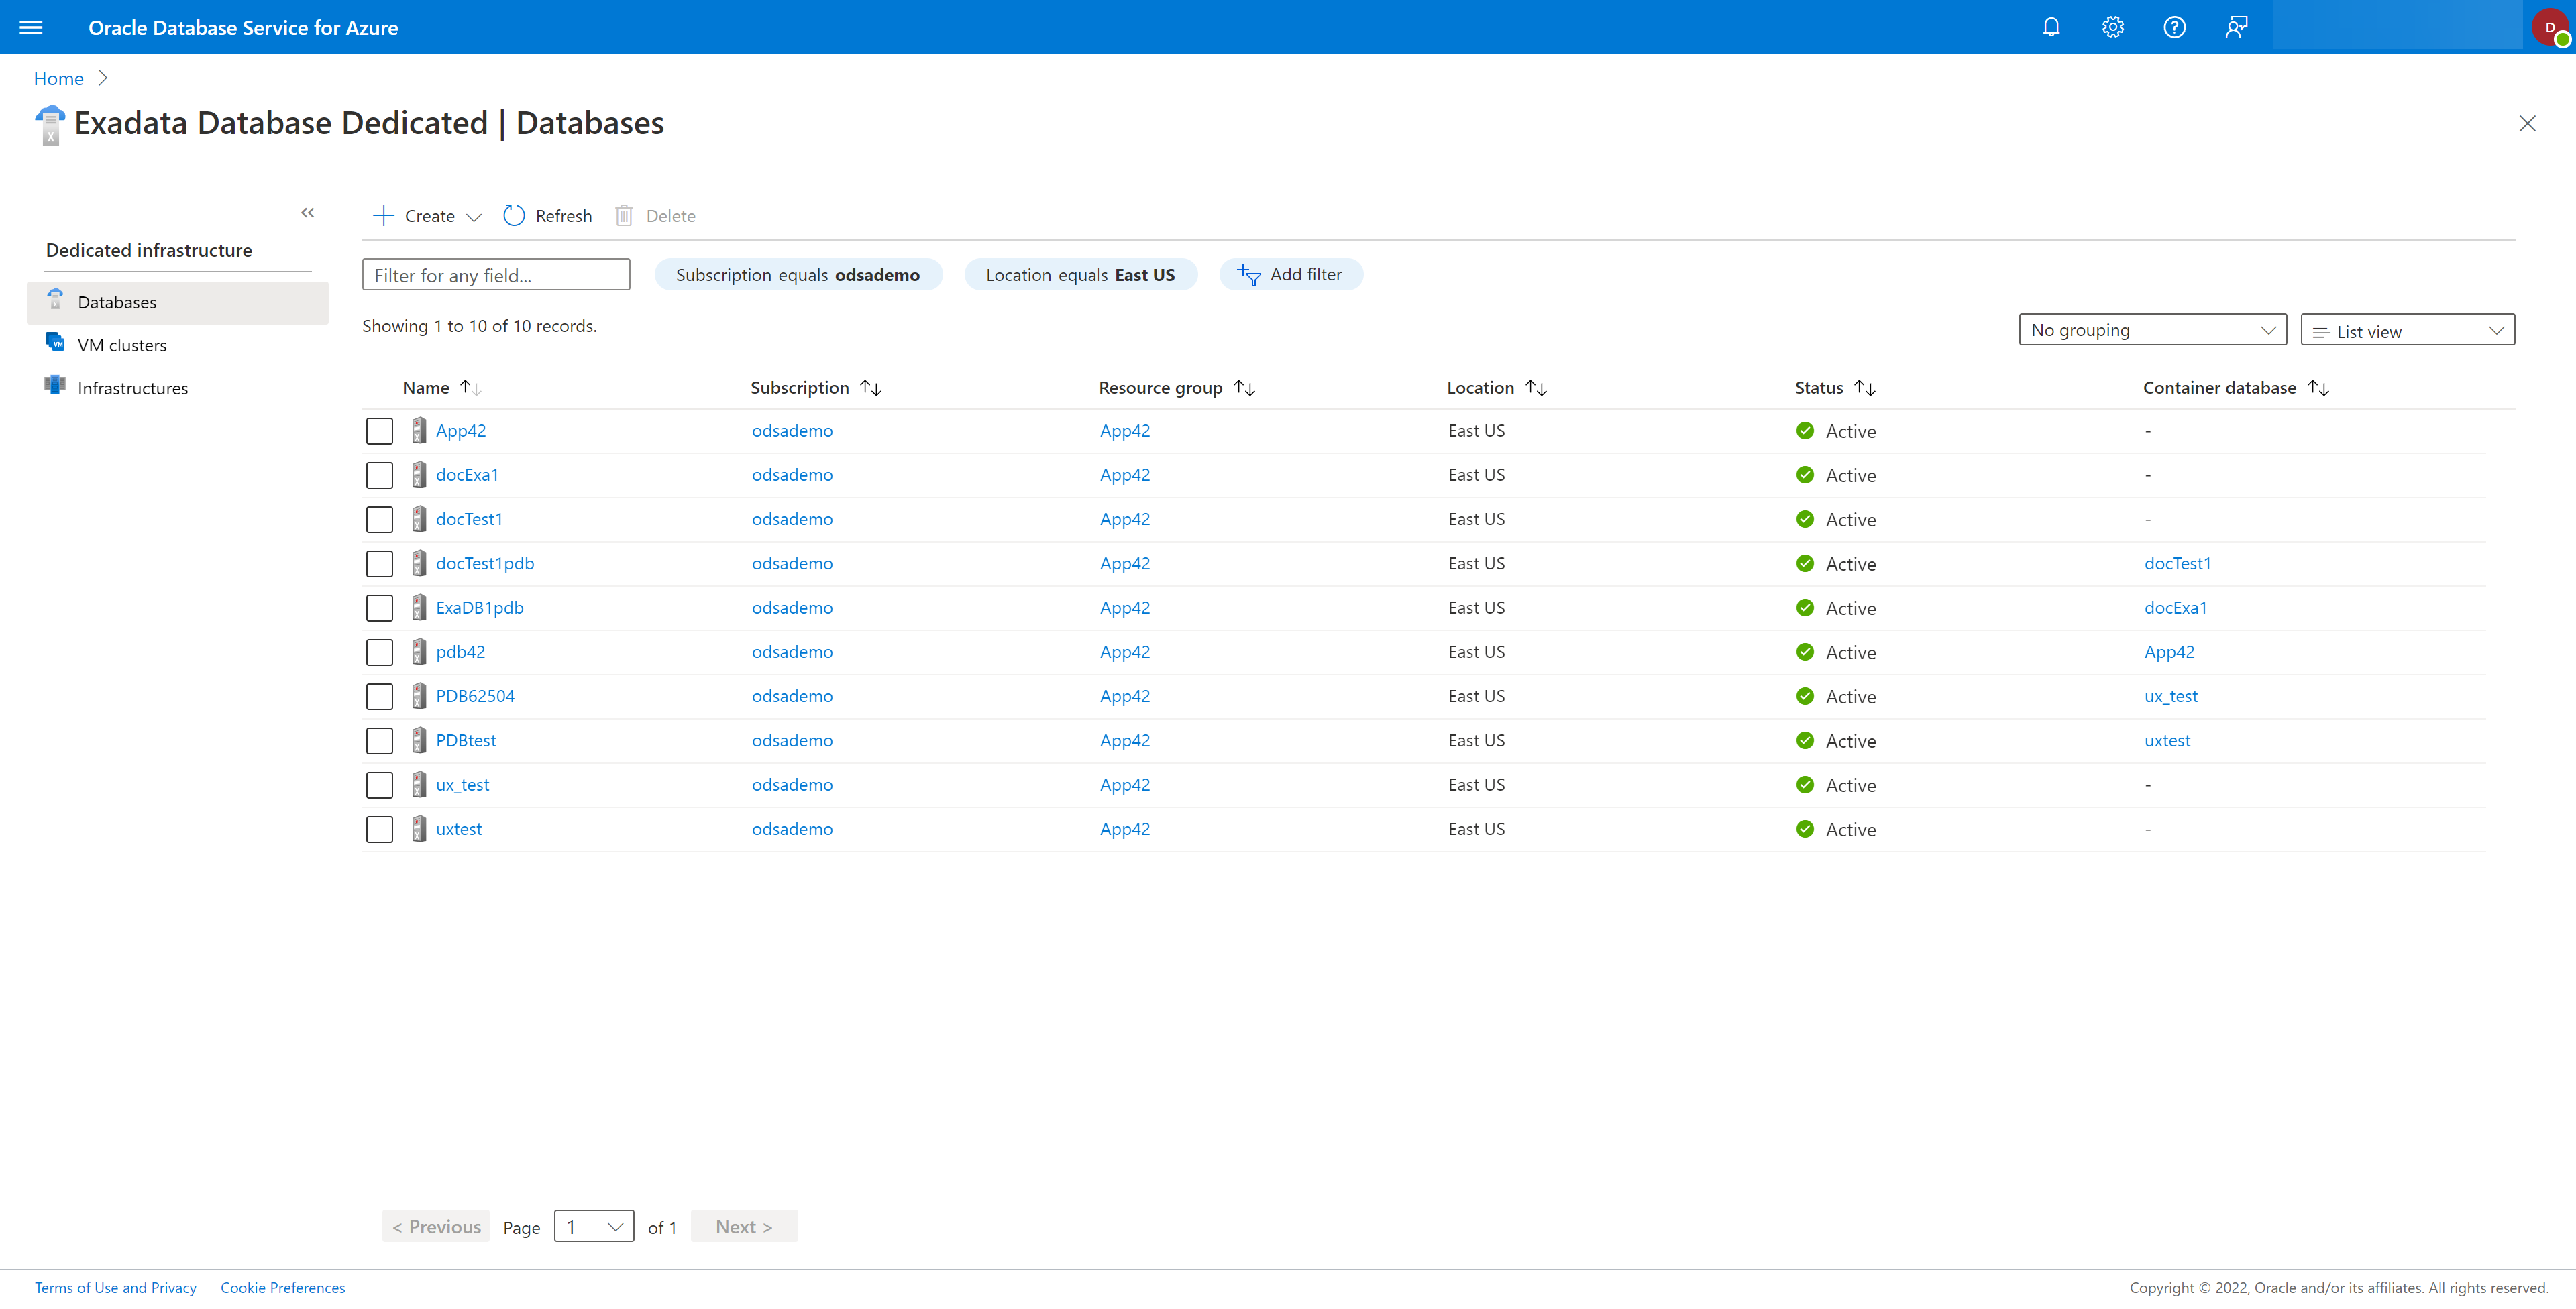
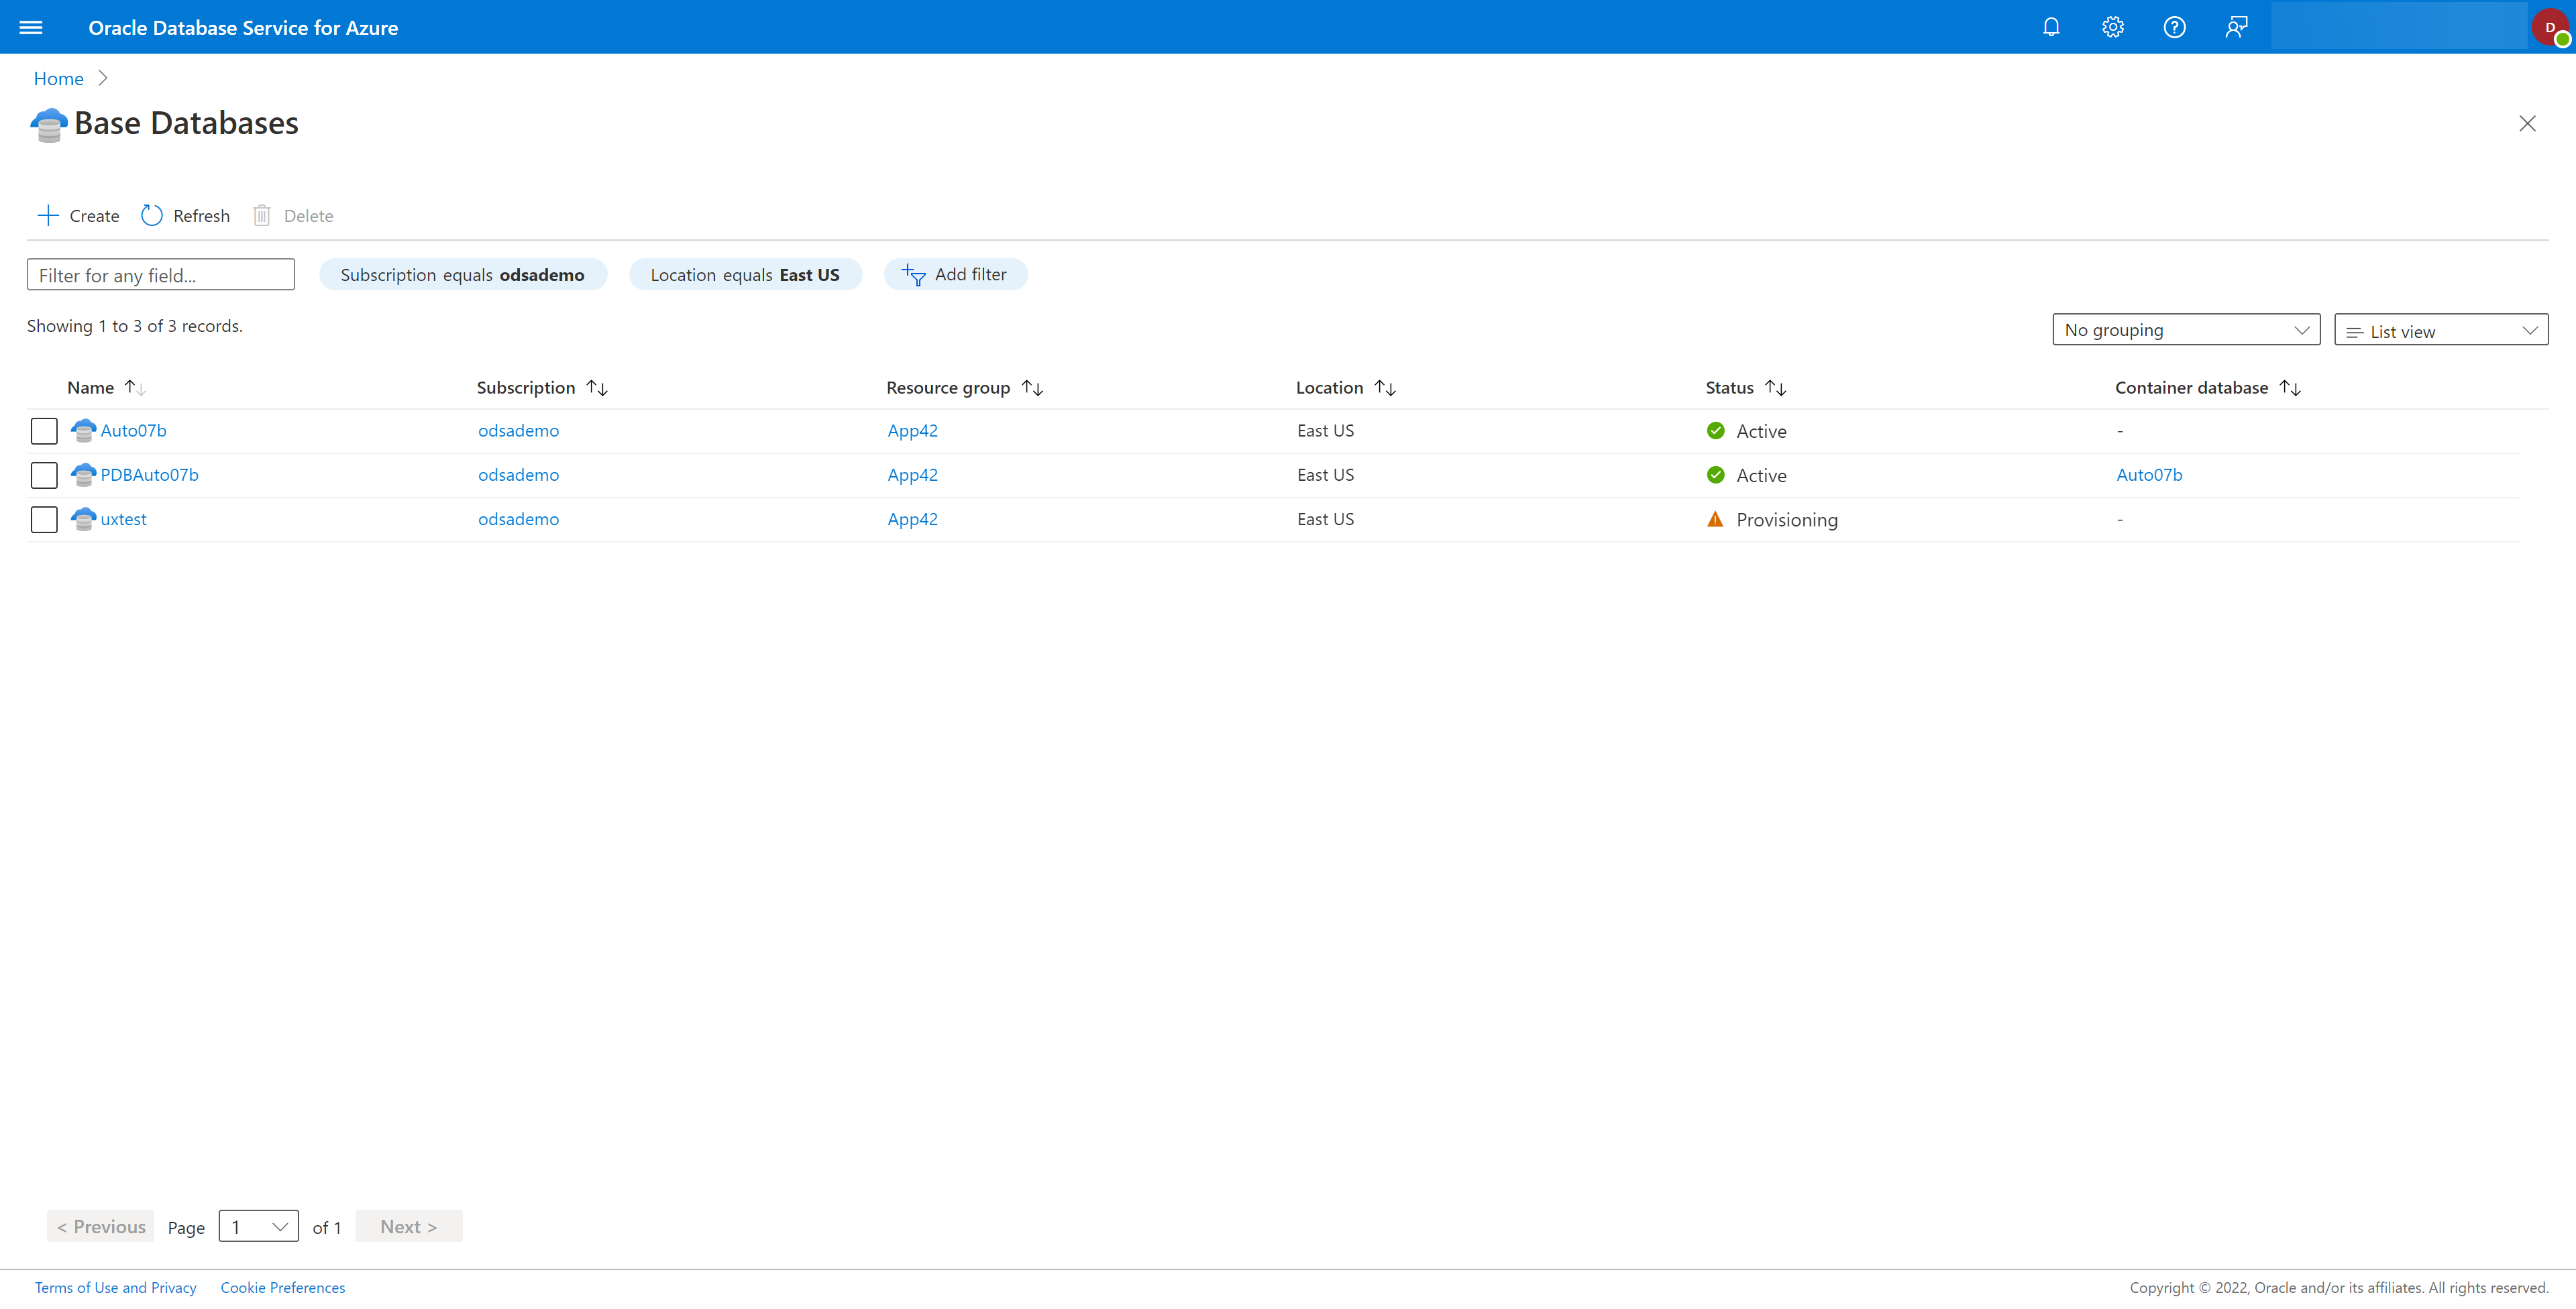
Viewing the Metrics for a Database in OracleDB for Azure is accomplished from the blade for the database you wish to stop. Each blade is slightly different and so are the database details, but the process is similar.
The following steps define the primary process for viewing your database metrics. In addition to this process, there is a mechanism provided through Microsoft Azure to view metrics. That process is defined at the end of these steps to provide a secondary approach, in desired.
- Go to the database blade for the database you wish to view its metrics.
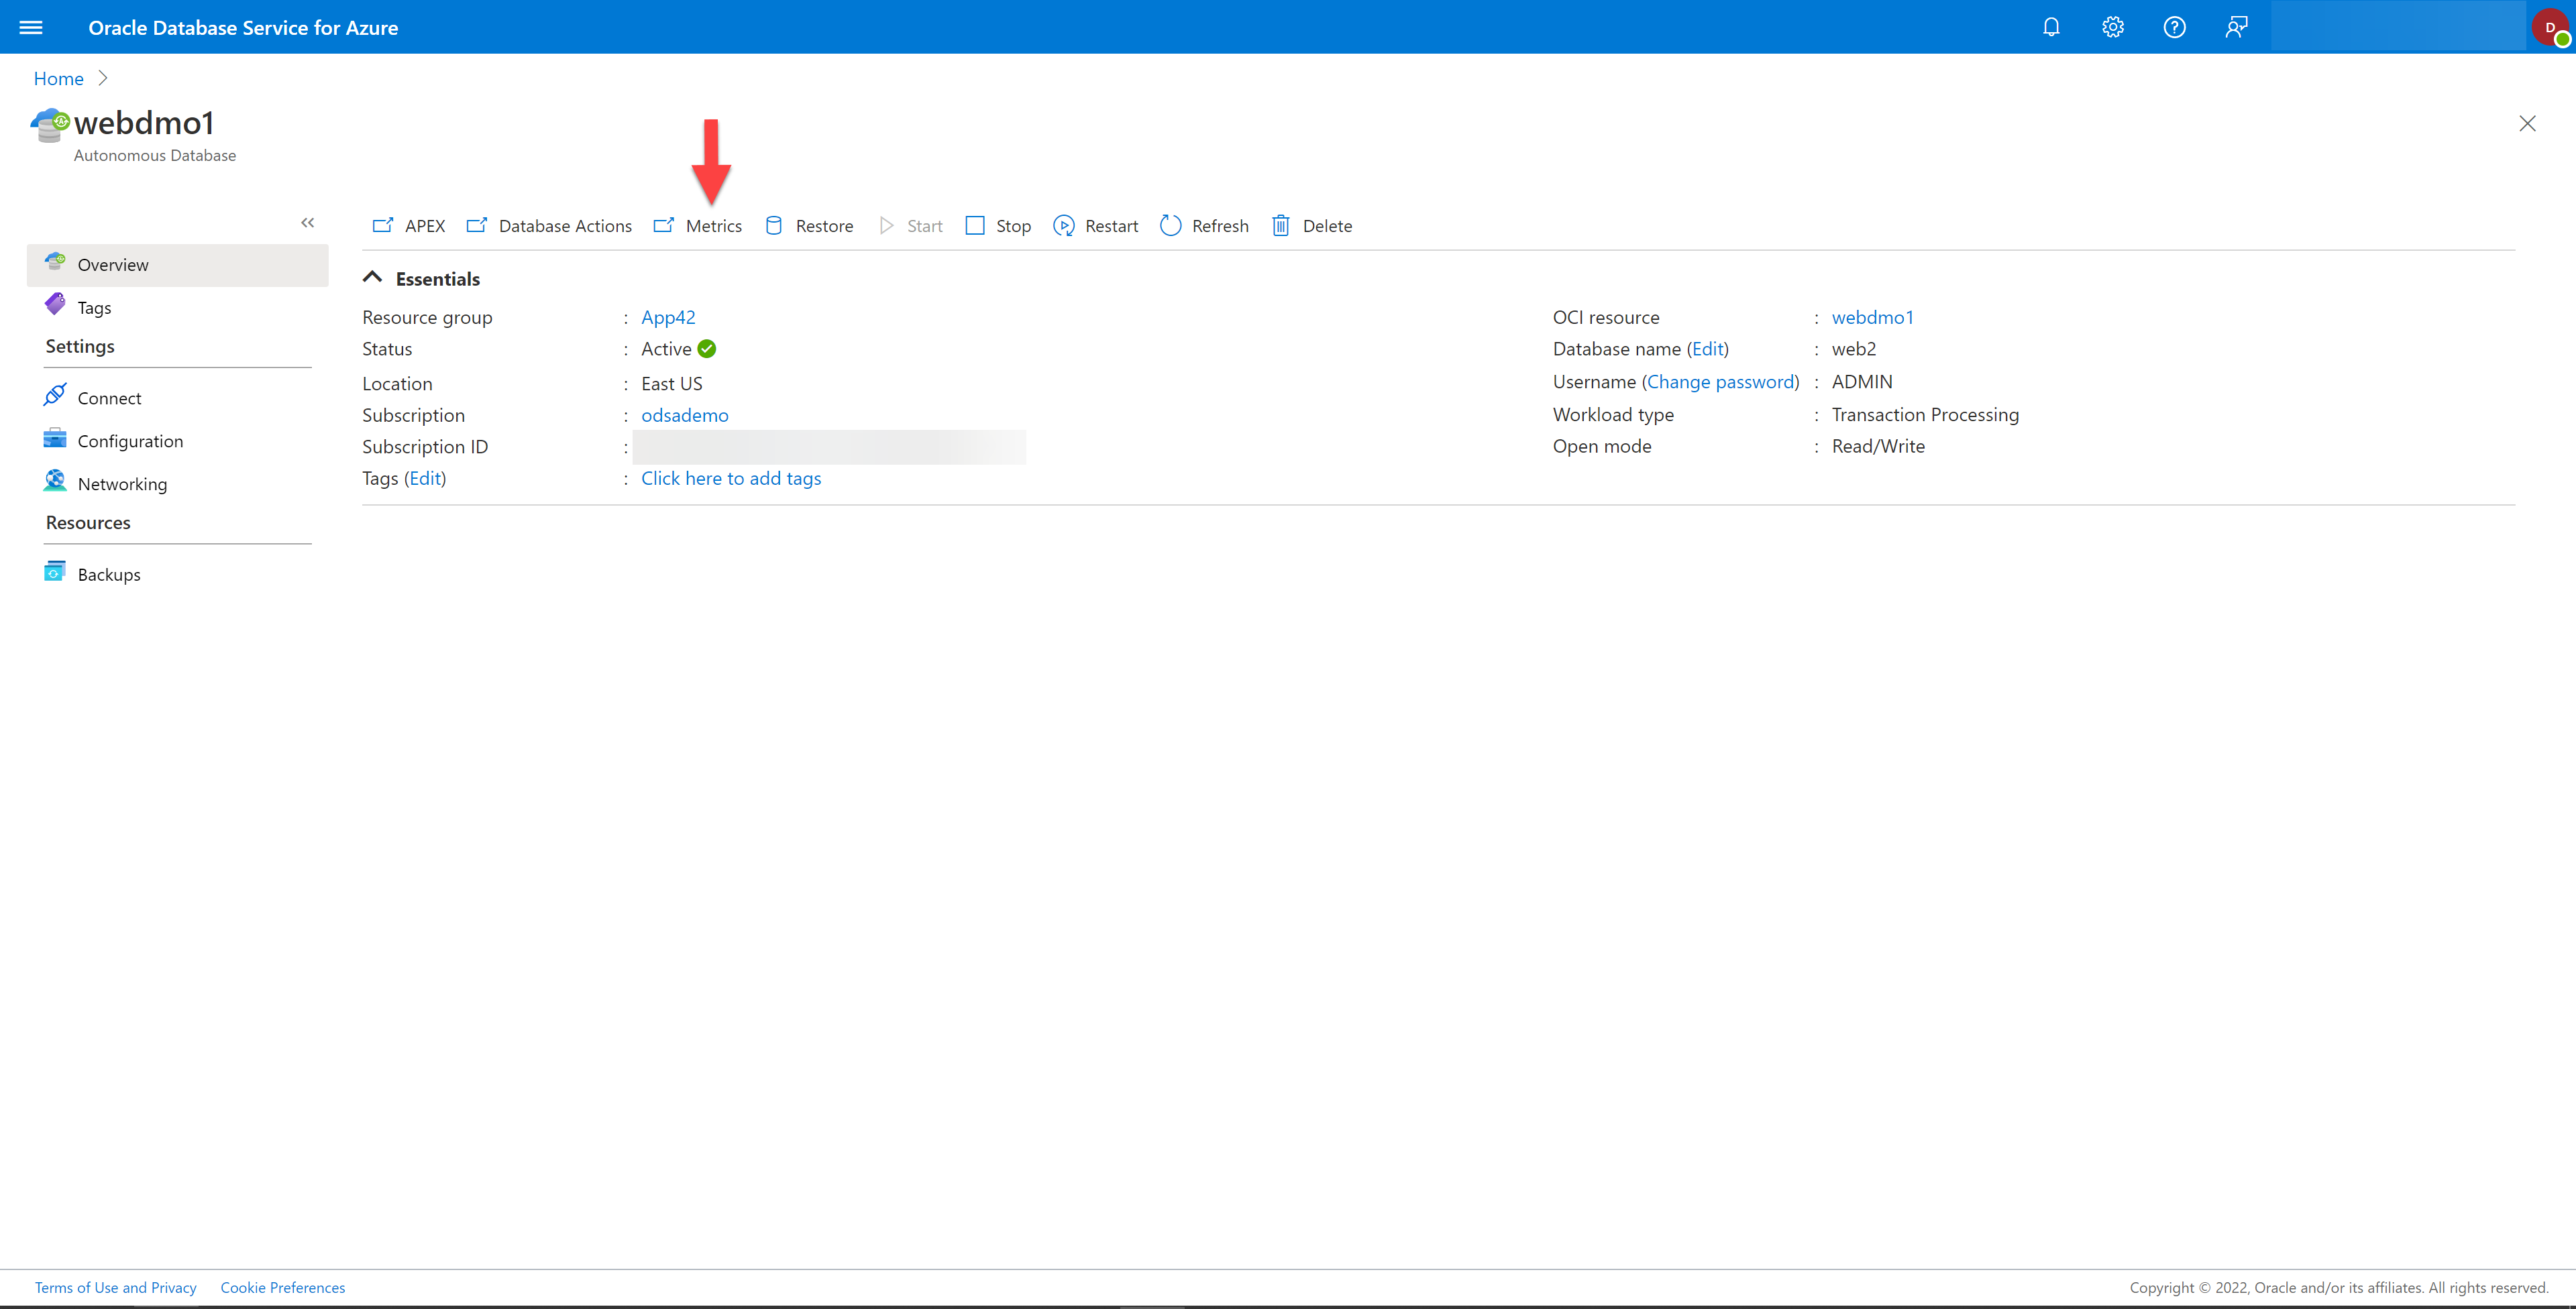
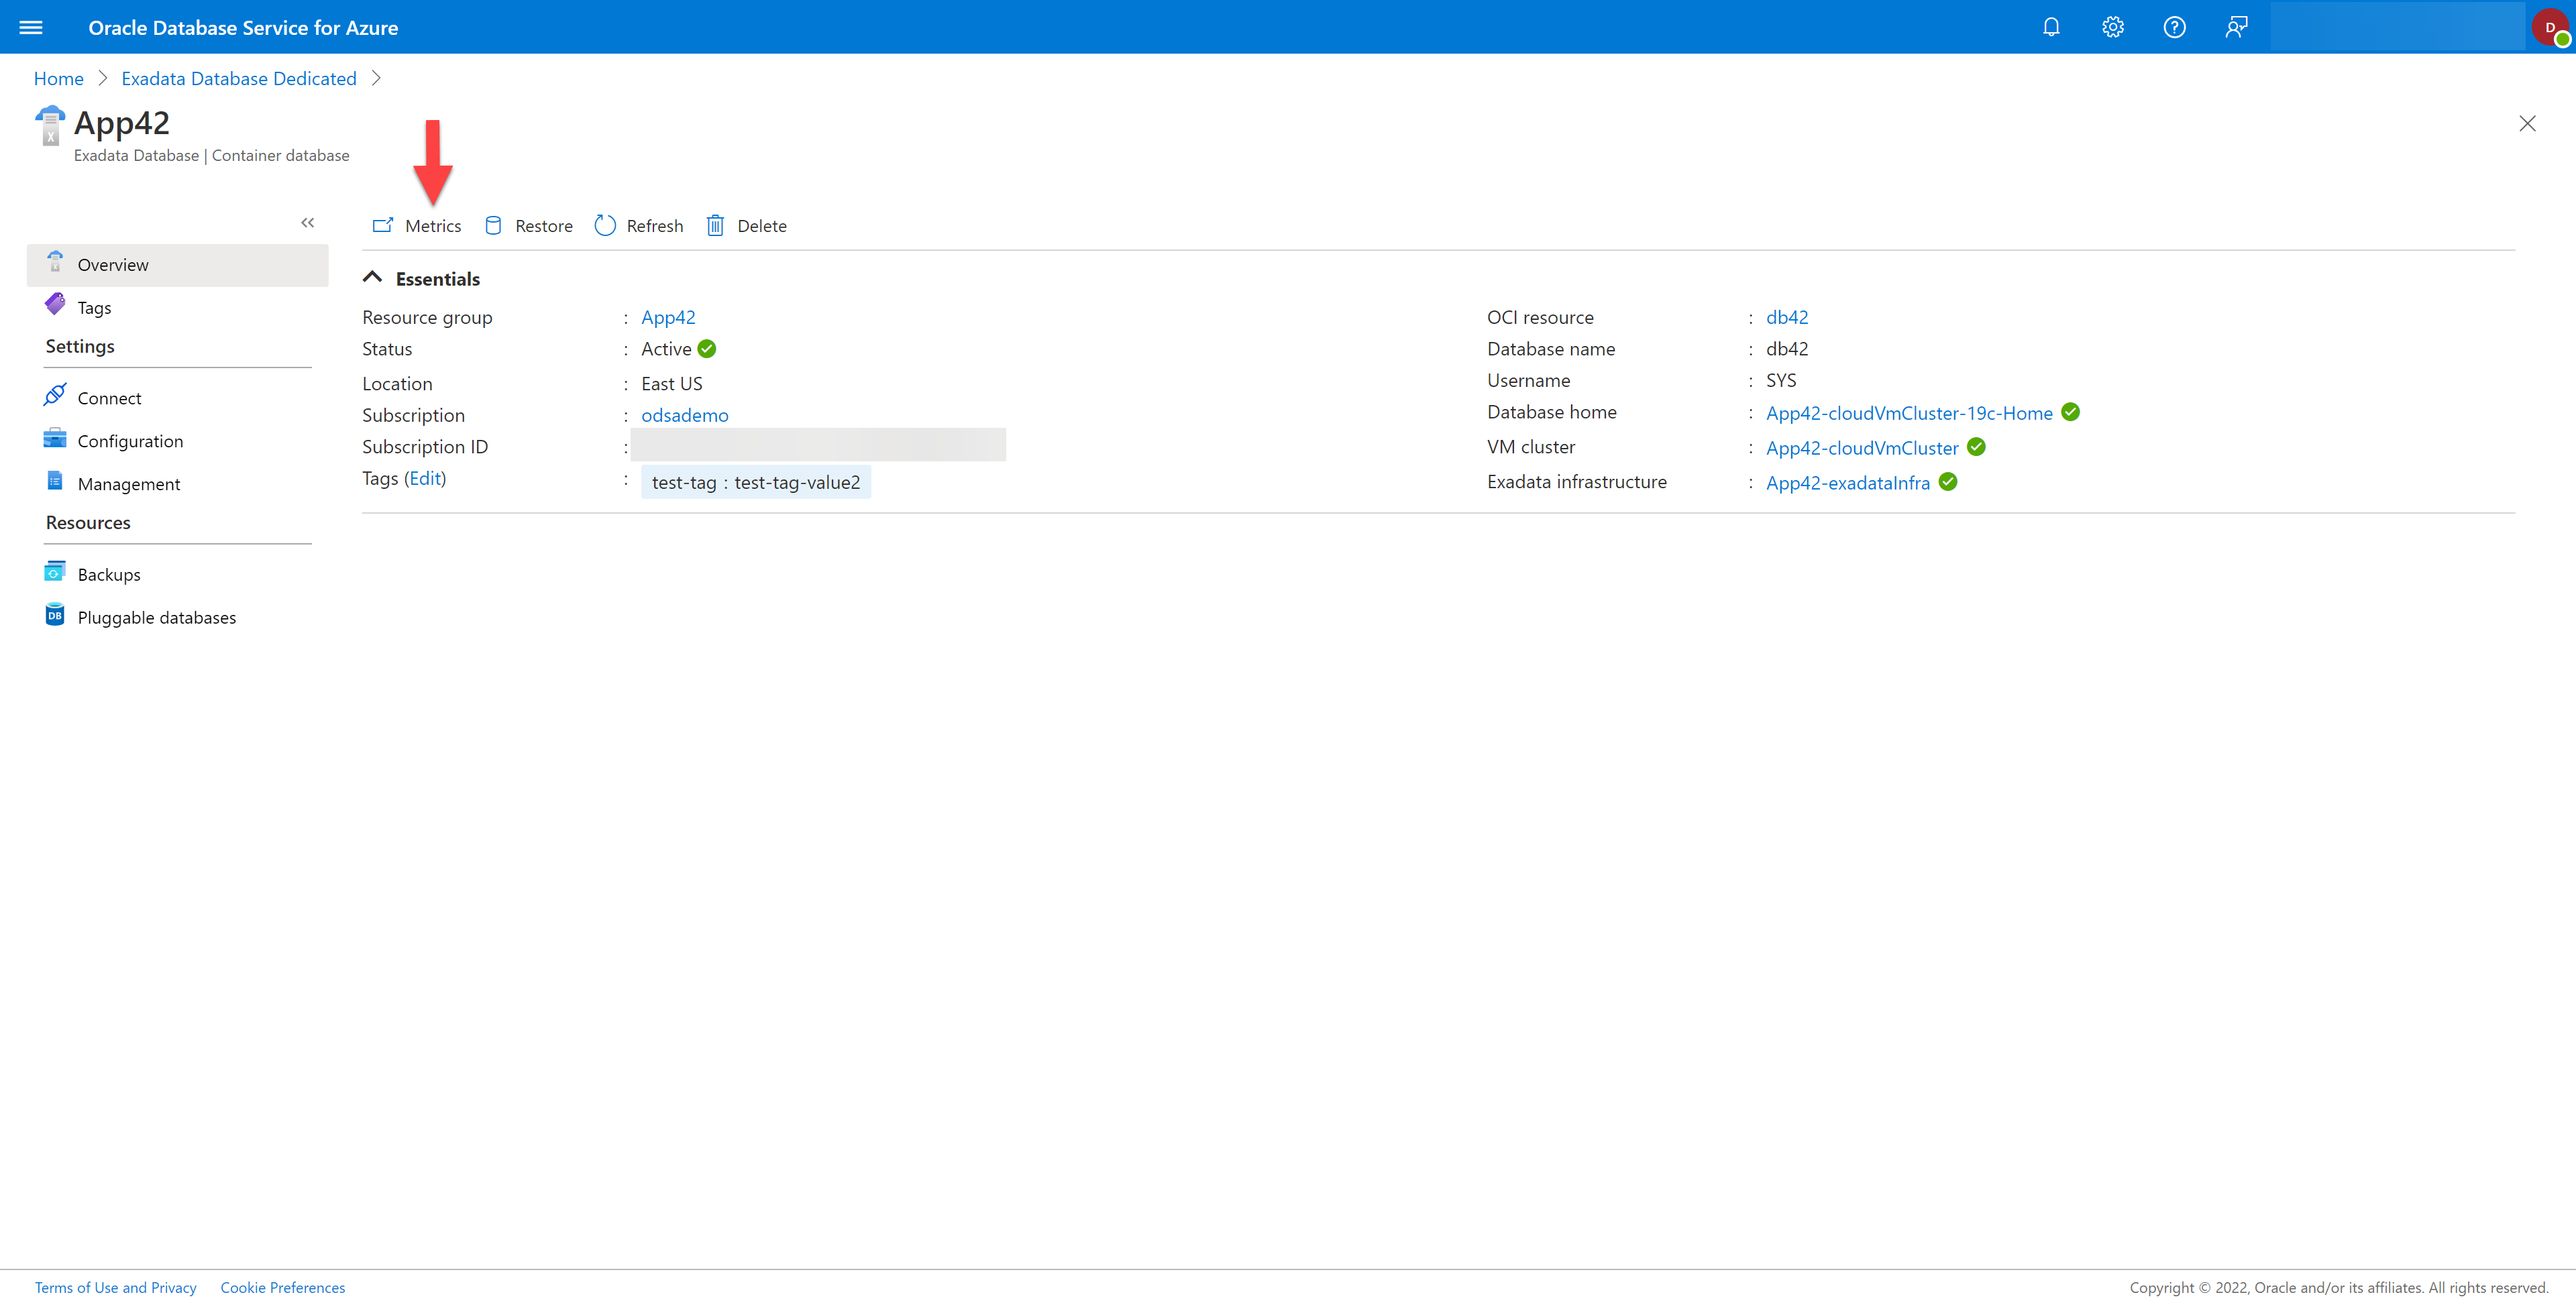
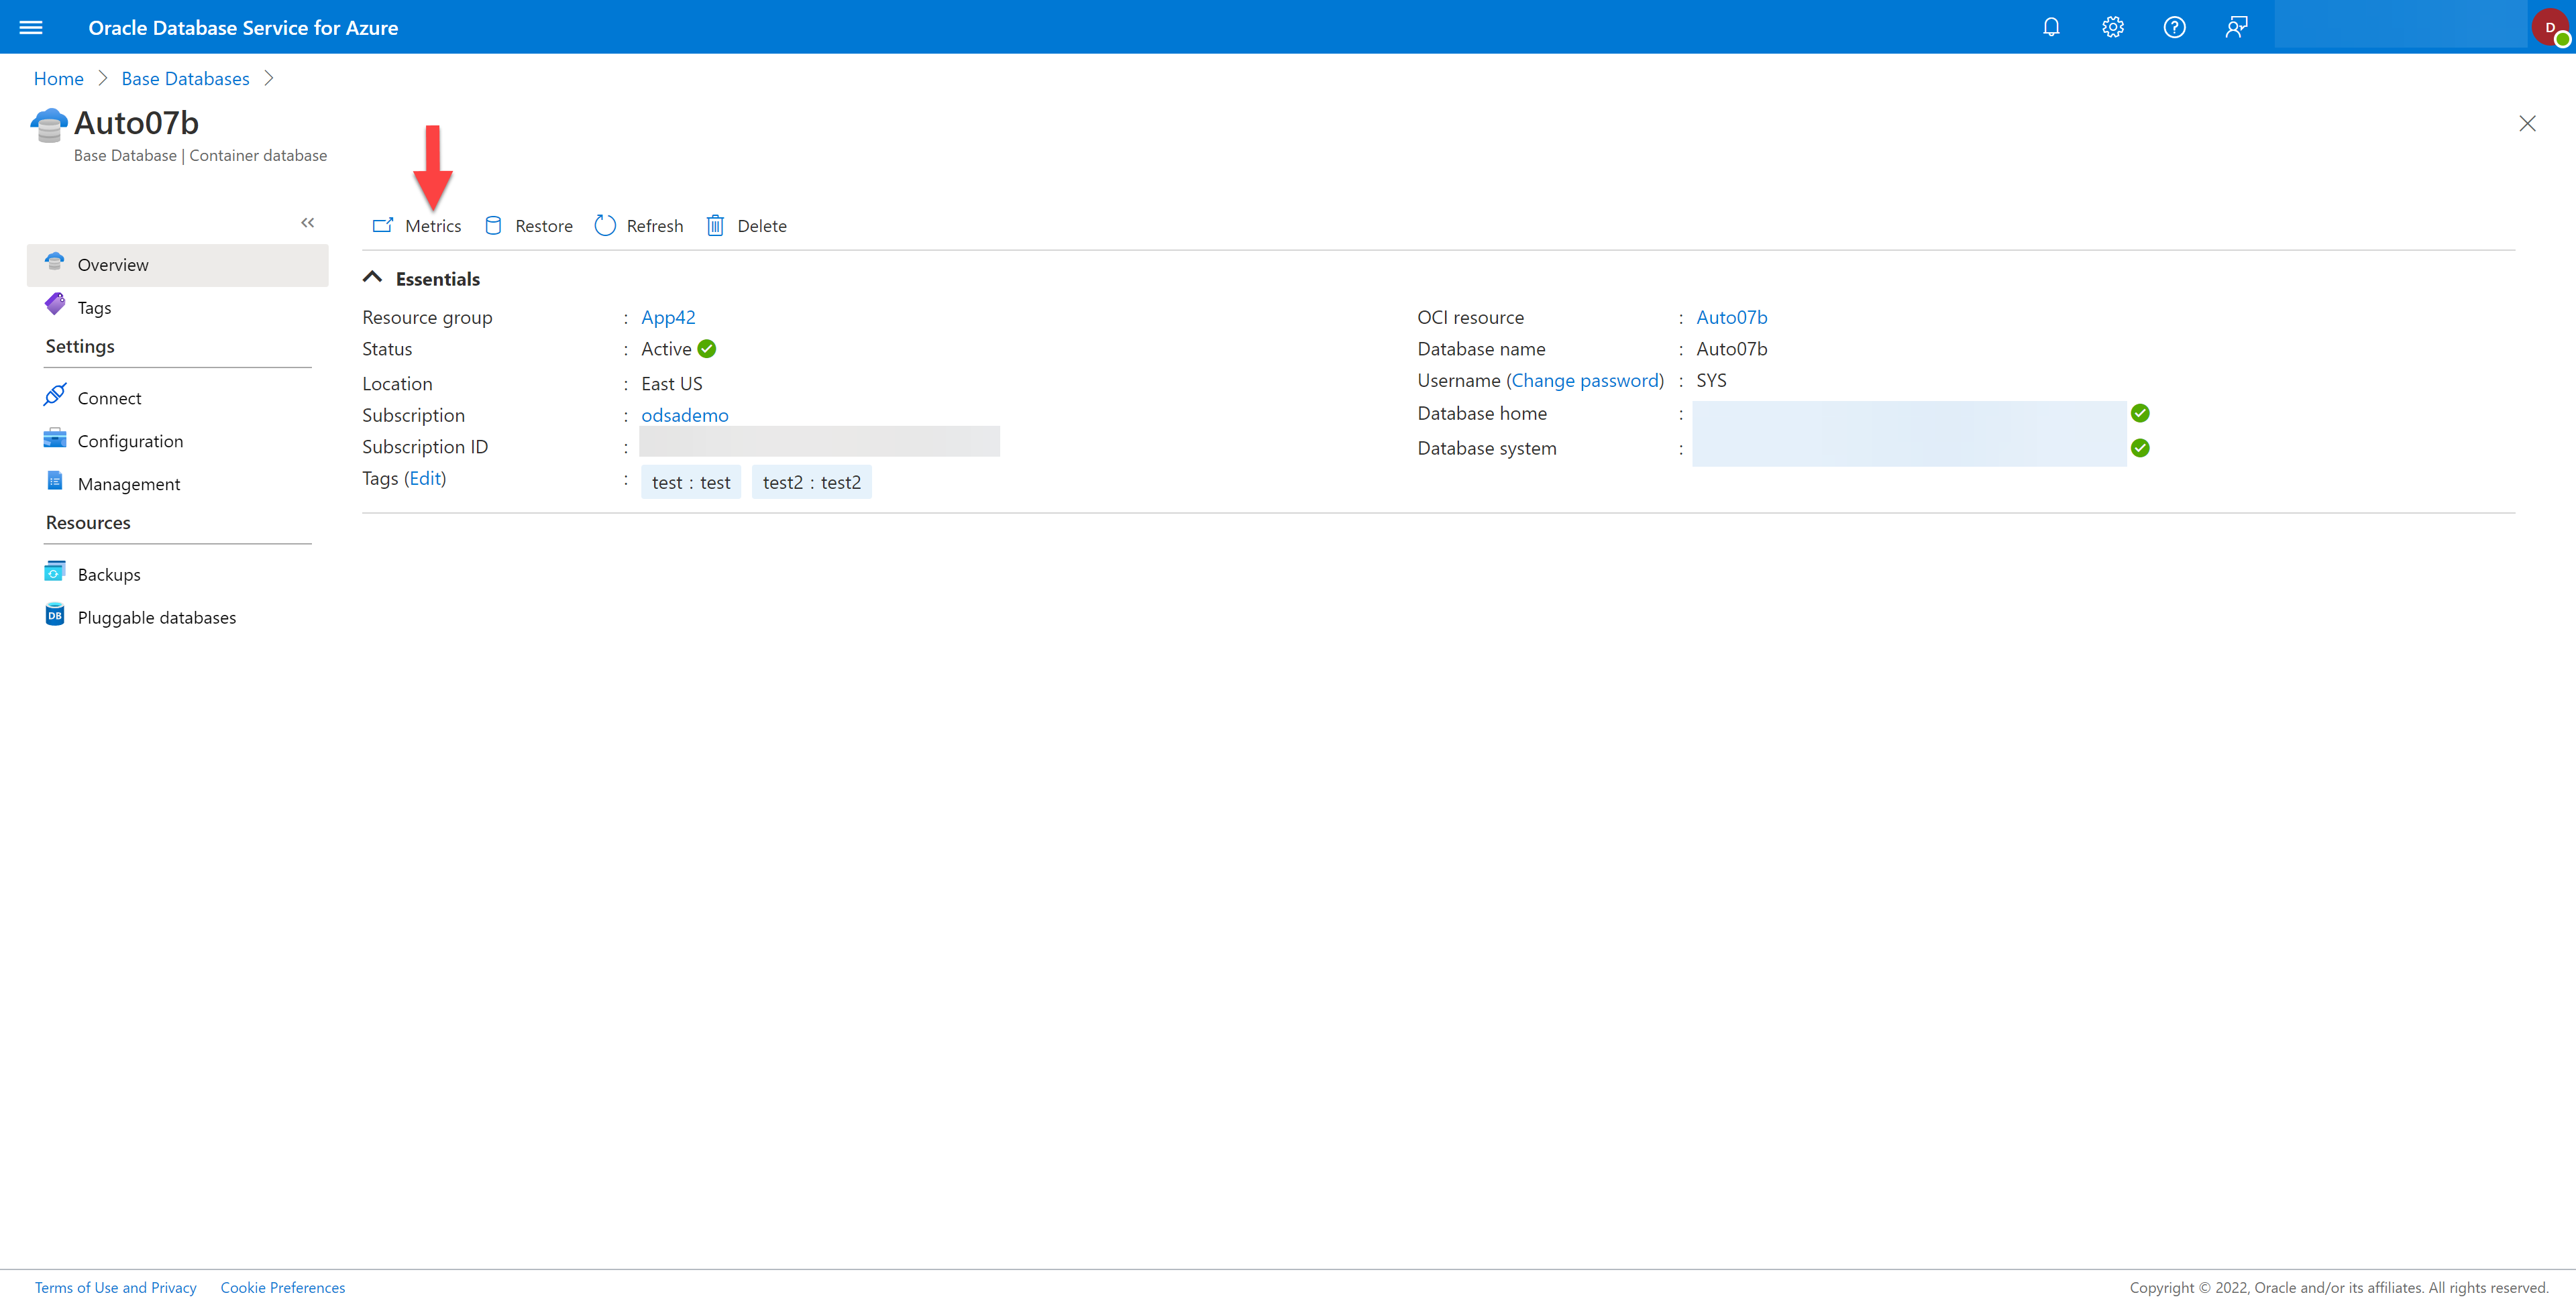
- Select the specific database you want to view from the list. This will open the details for that specific database, as shown in the example below.
- Select the Metrics icon. If the Metrics icon is not active, the database does not yet have viewable metrics. See Resolving the Metrics Icon Not Showing for a Database for more information.
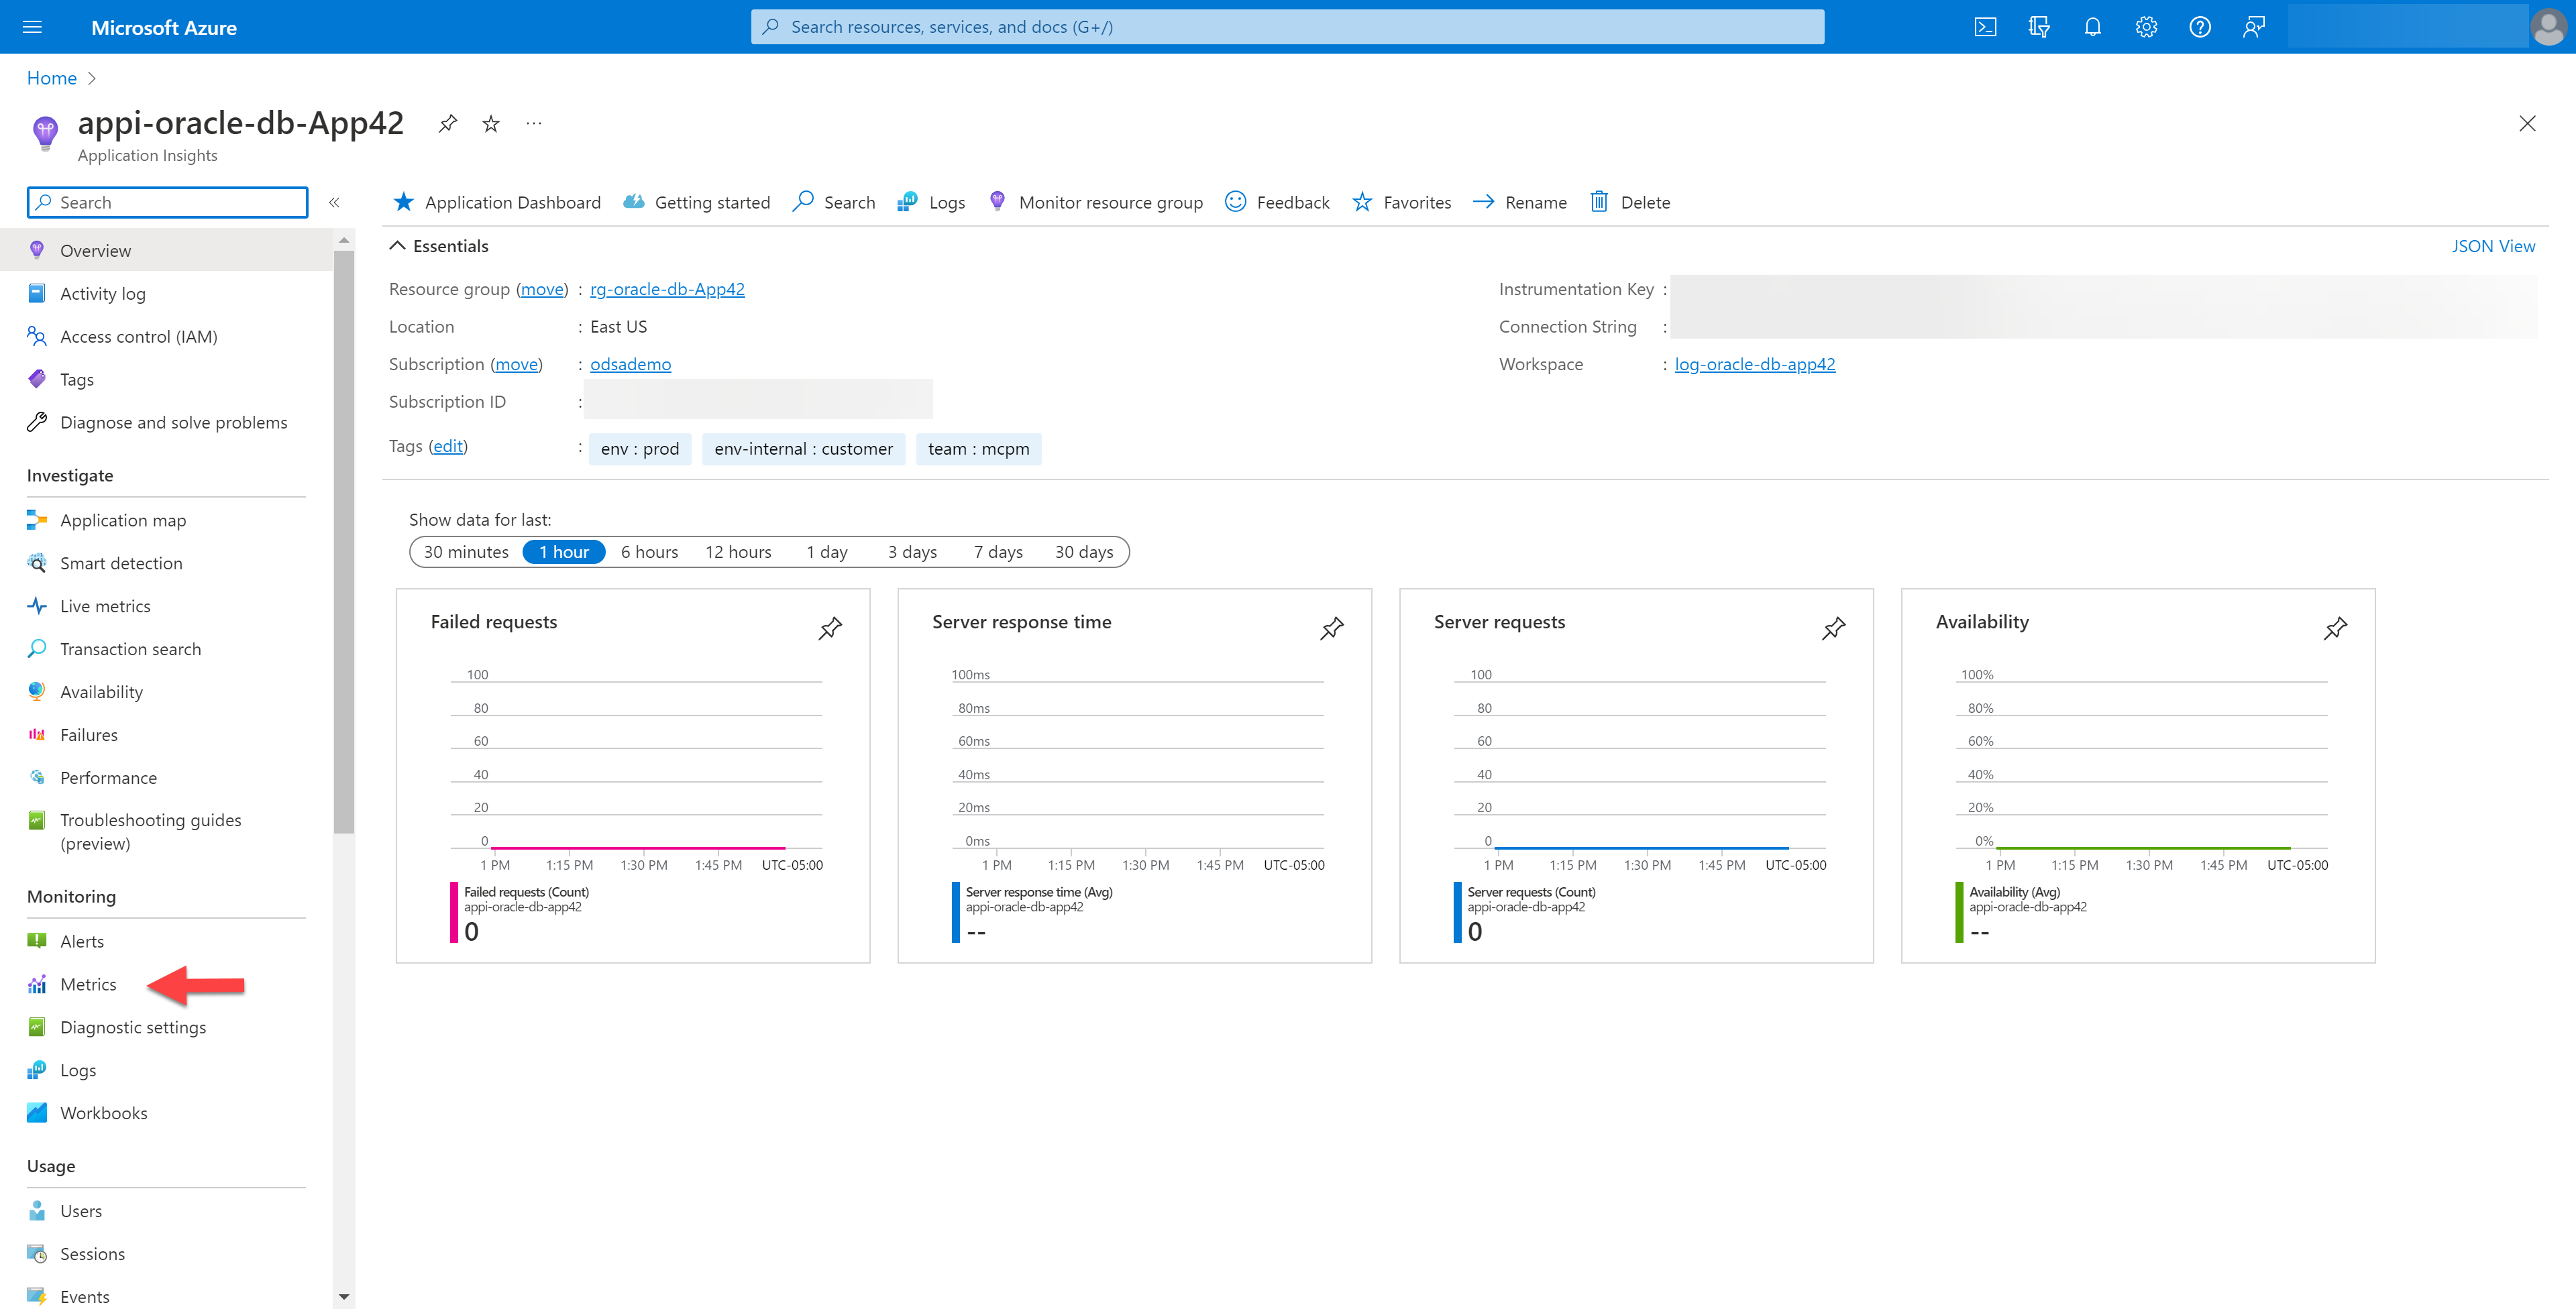
- The Microsoft Azure Application Insights blade opens.
- You can learn more about Microsoft Azure Application Insights at About Application Insights .
- Select the Metrics link on the left-side menu.
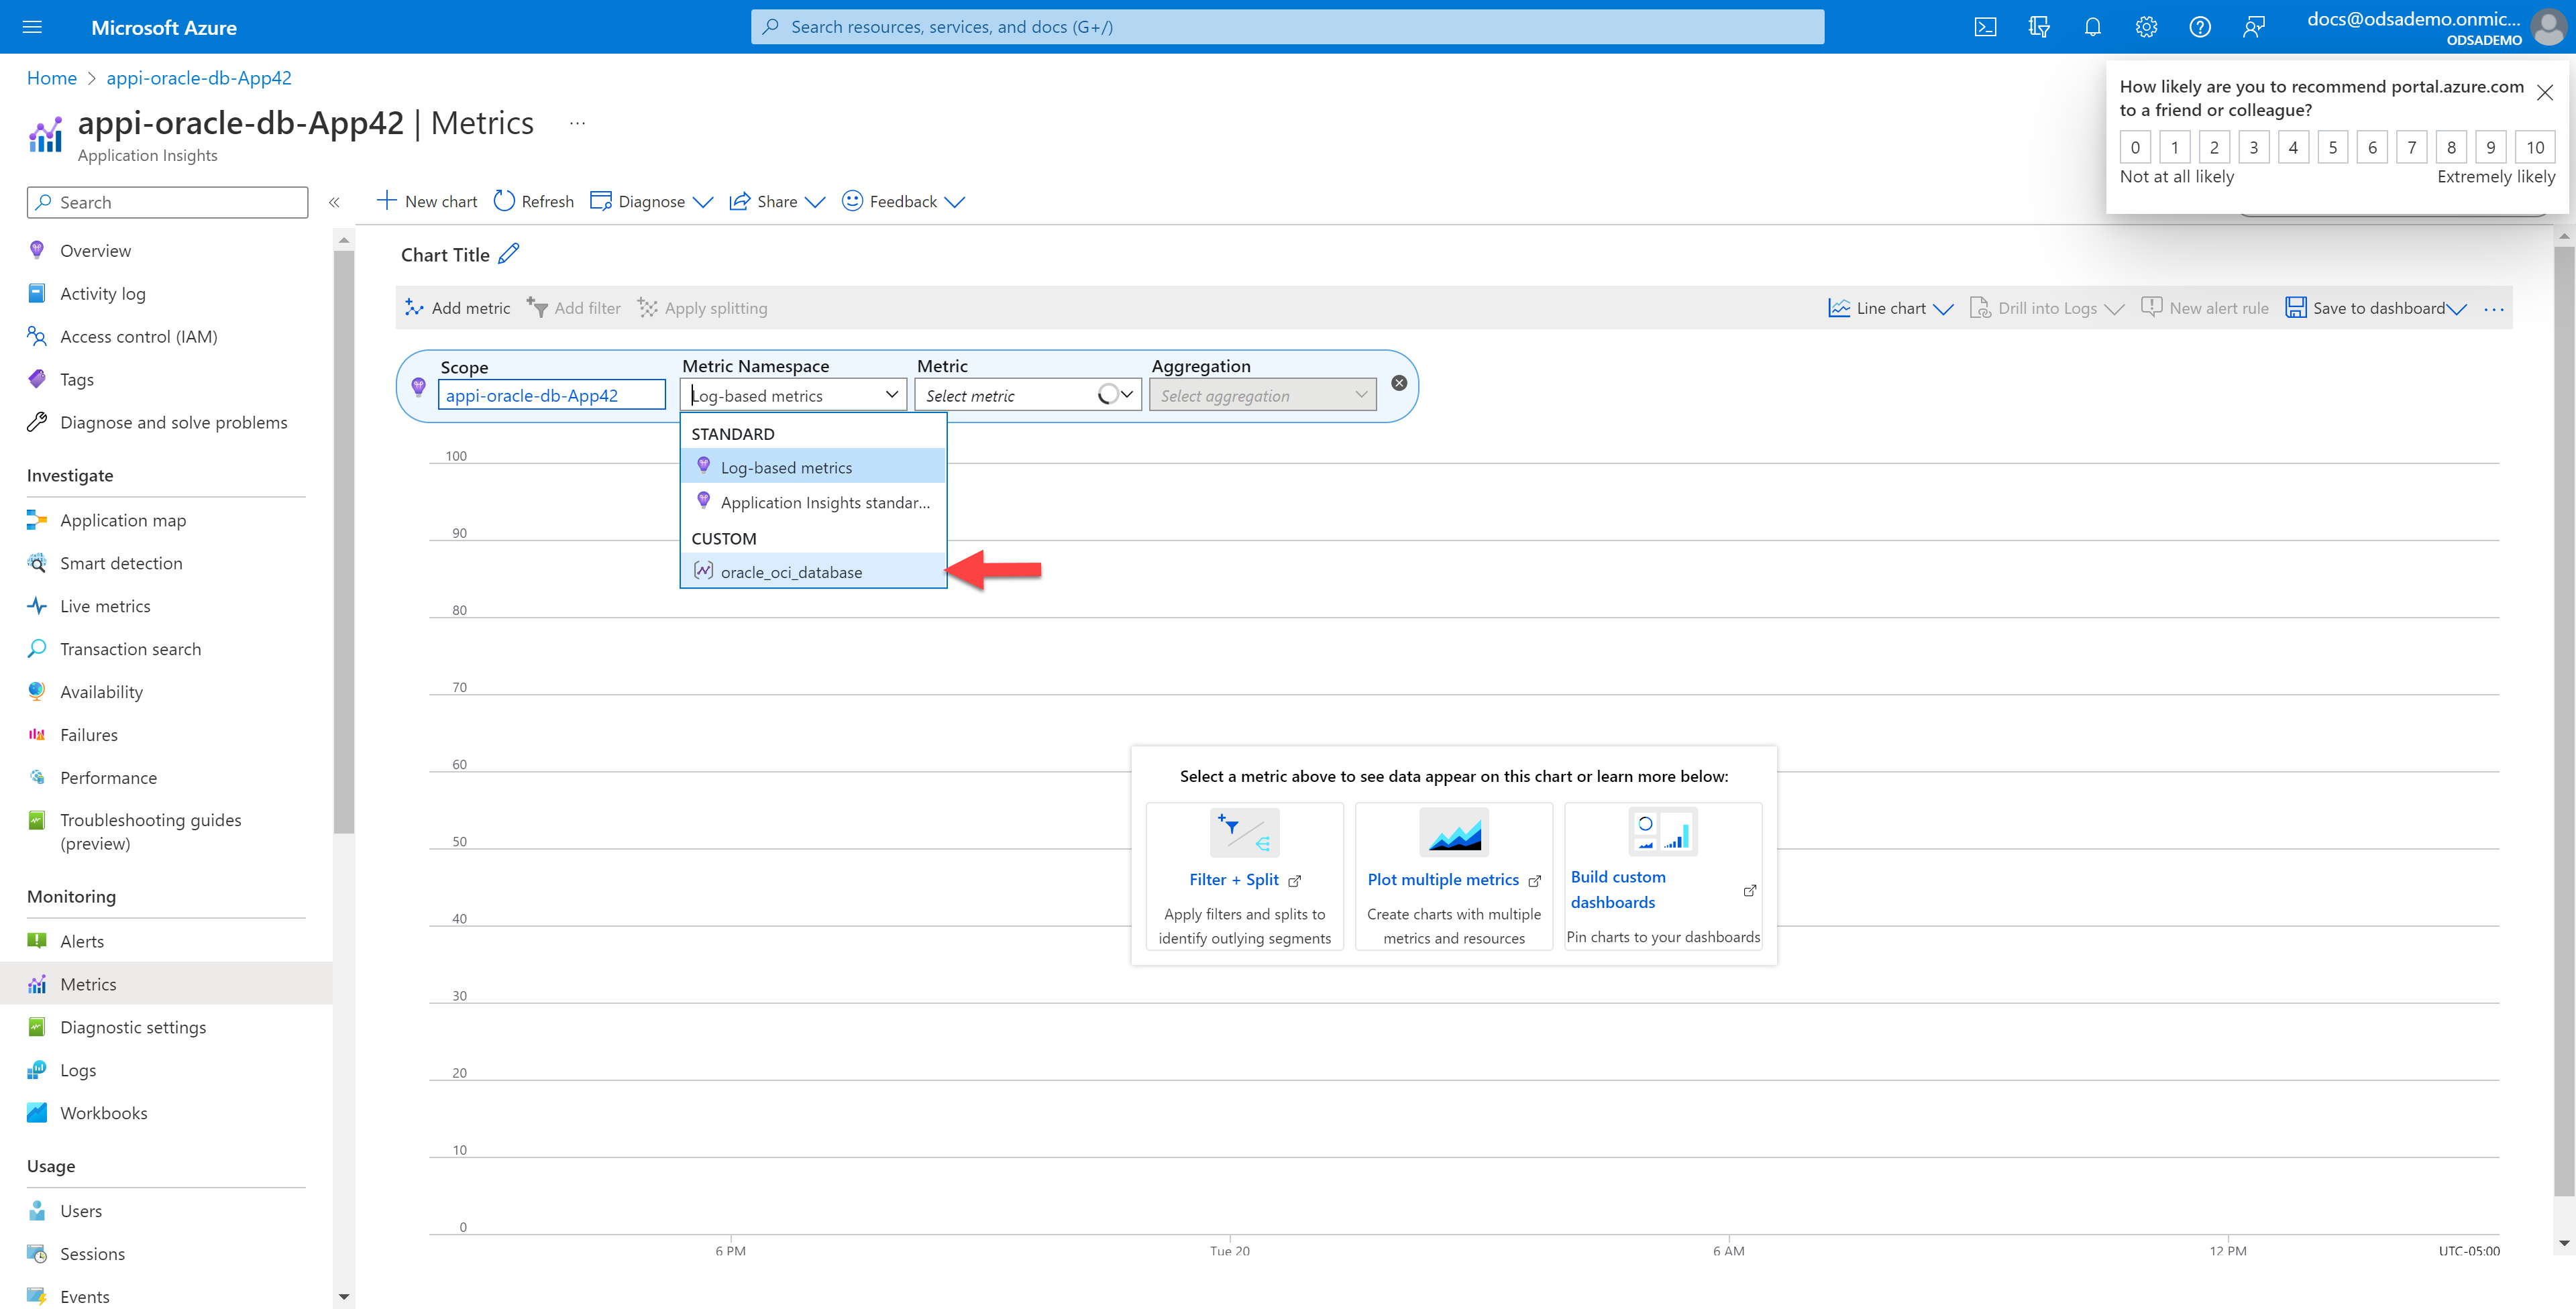
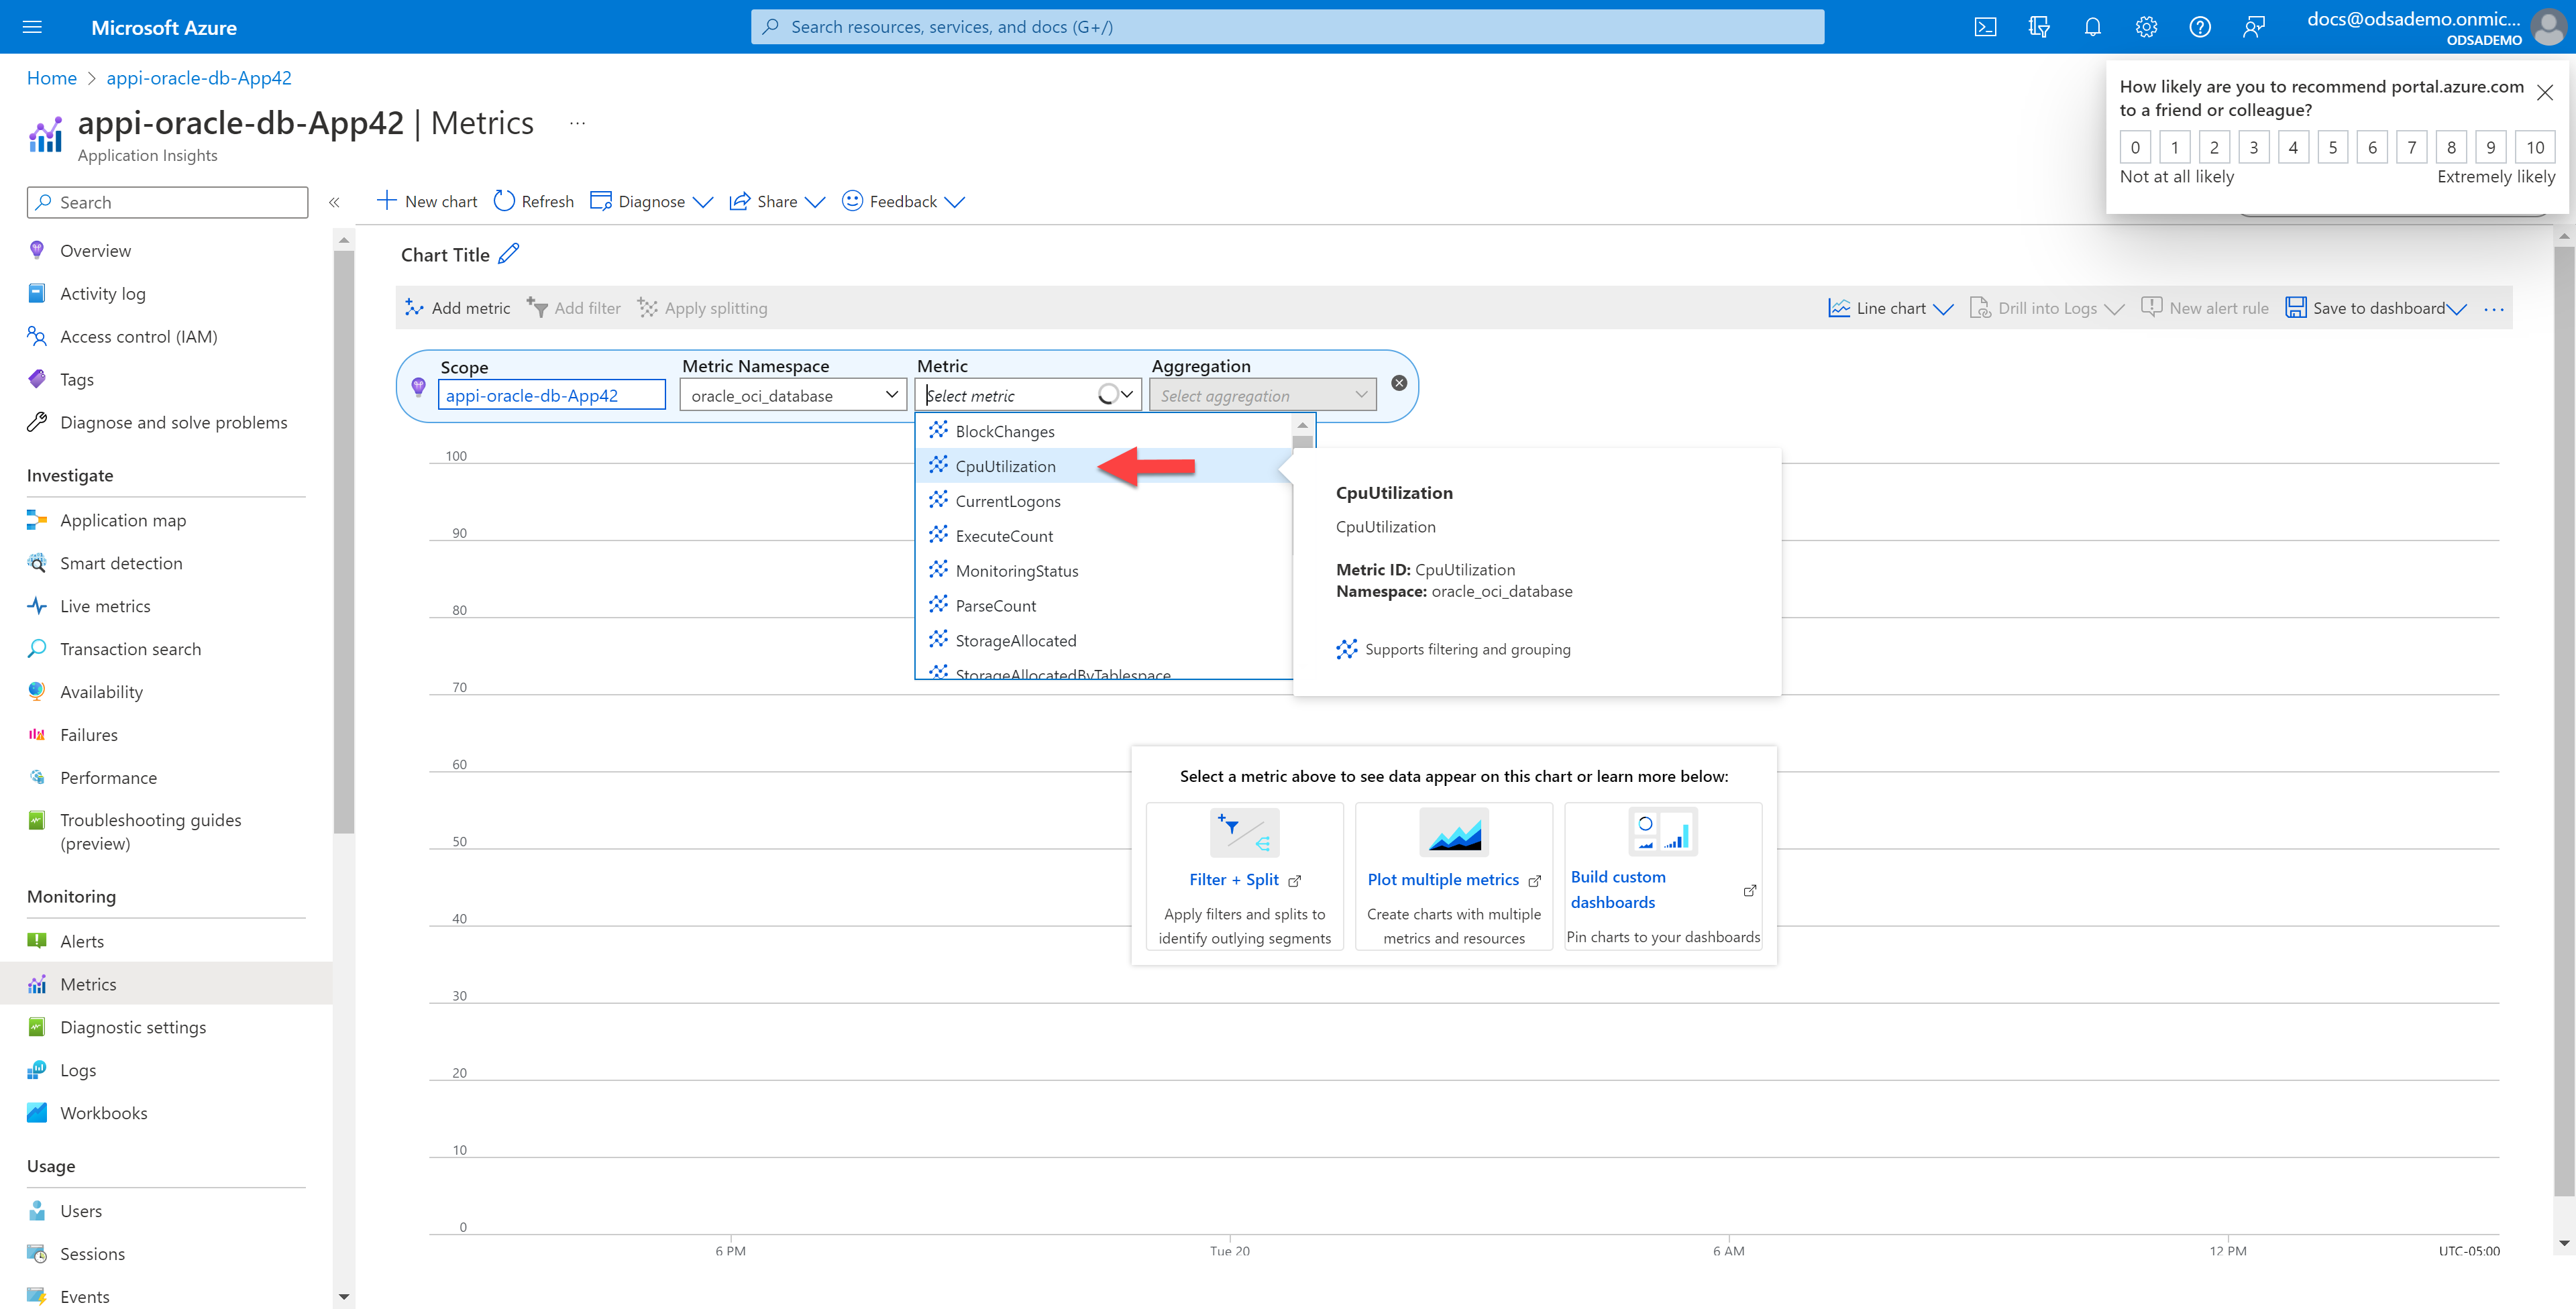
- This is the Metrics blade. You can select a variety of metrics to display. Before you can see any metrics, you must select the Metrics Namespace and the specific metric or metrics you wish to chart.
By default, the starting
Metrics Namespace is the
Log-based Metrics namespace. For a
Oracle Autonomous Database Serverless, an
Oracle Exadata Database, a
Oracle Base Database, or an
Oracle HeatWave Database, you will need to select the namespace as follows:
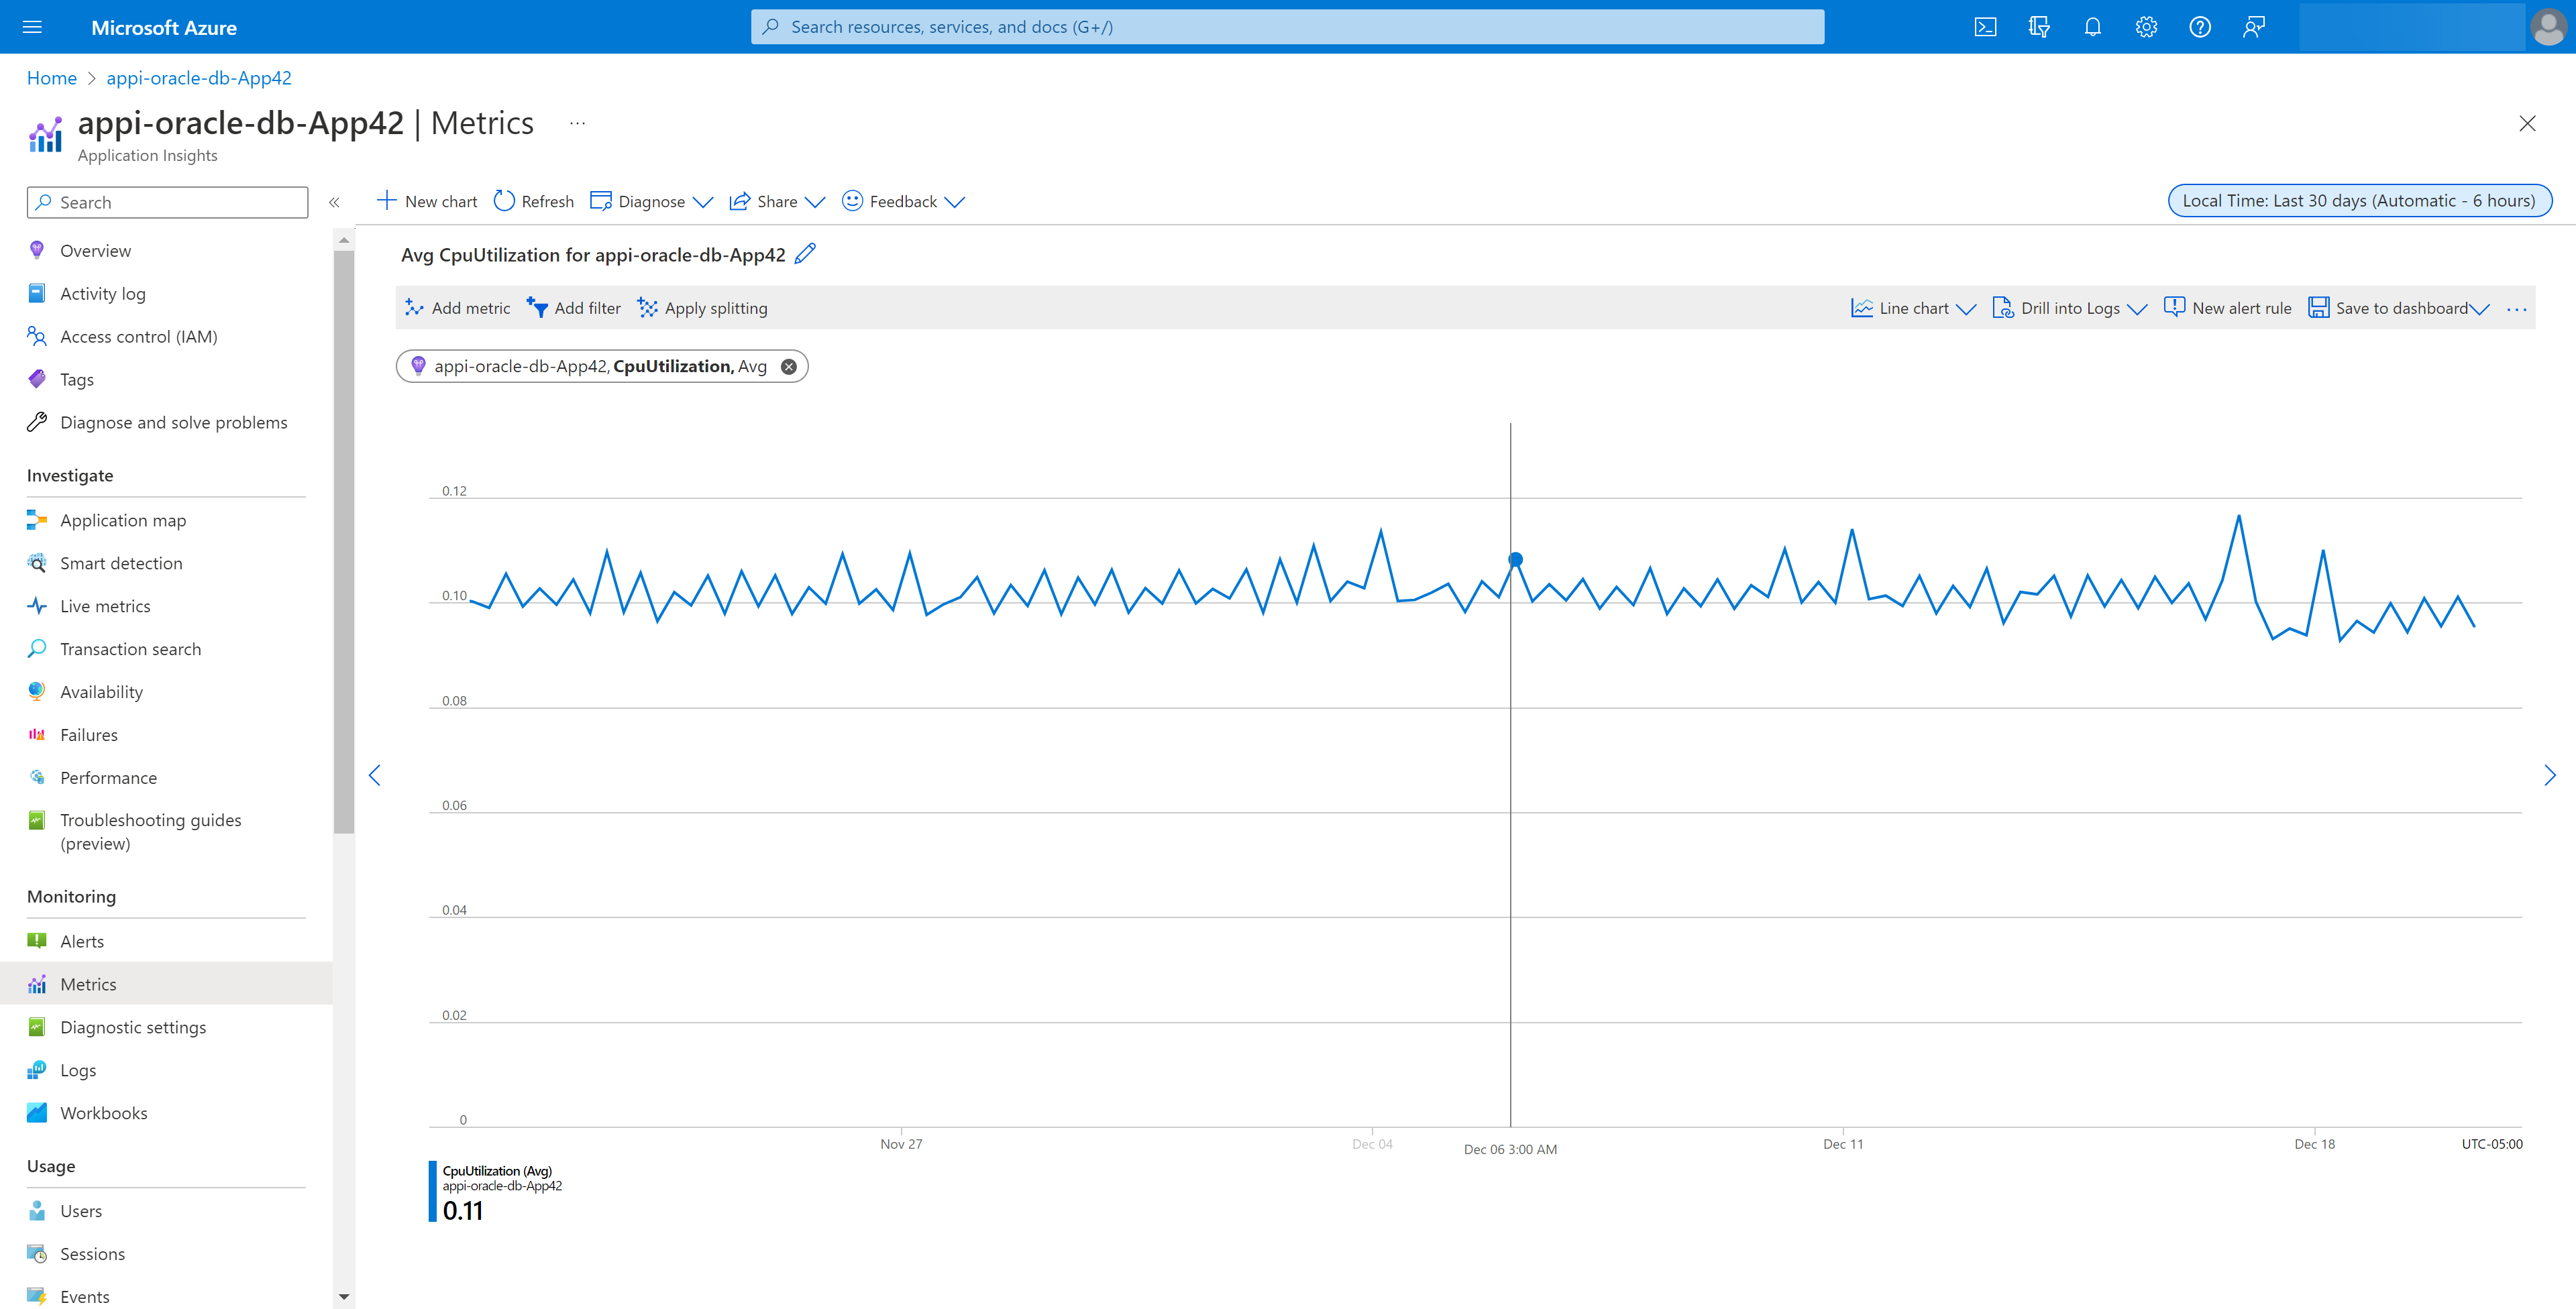
- Select the Metric or Metrics you wish to chart.
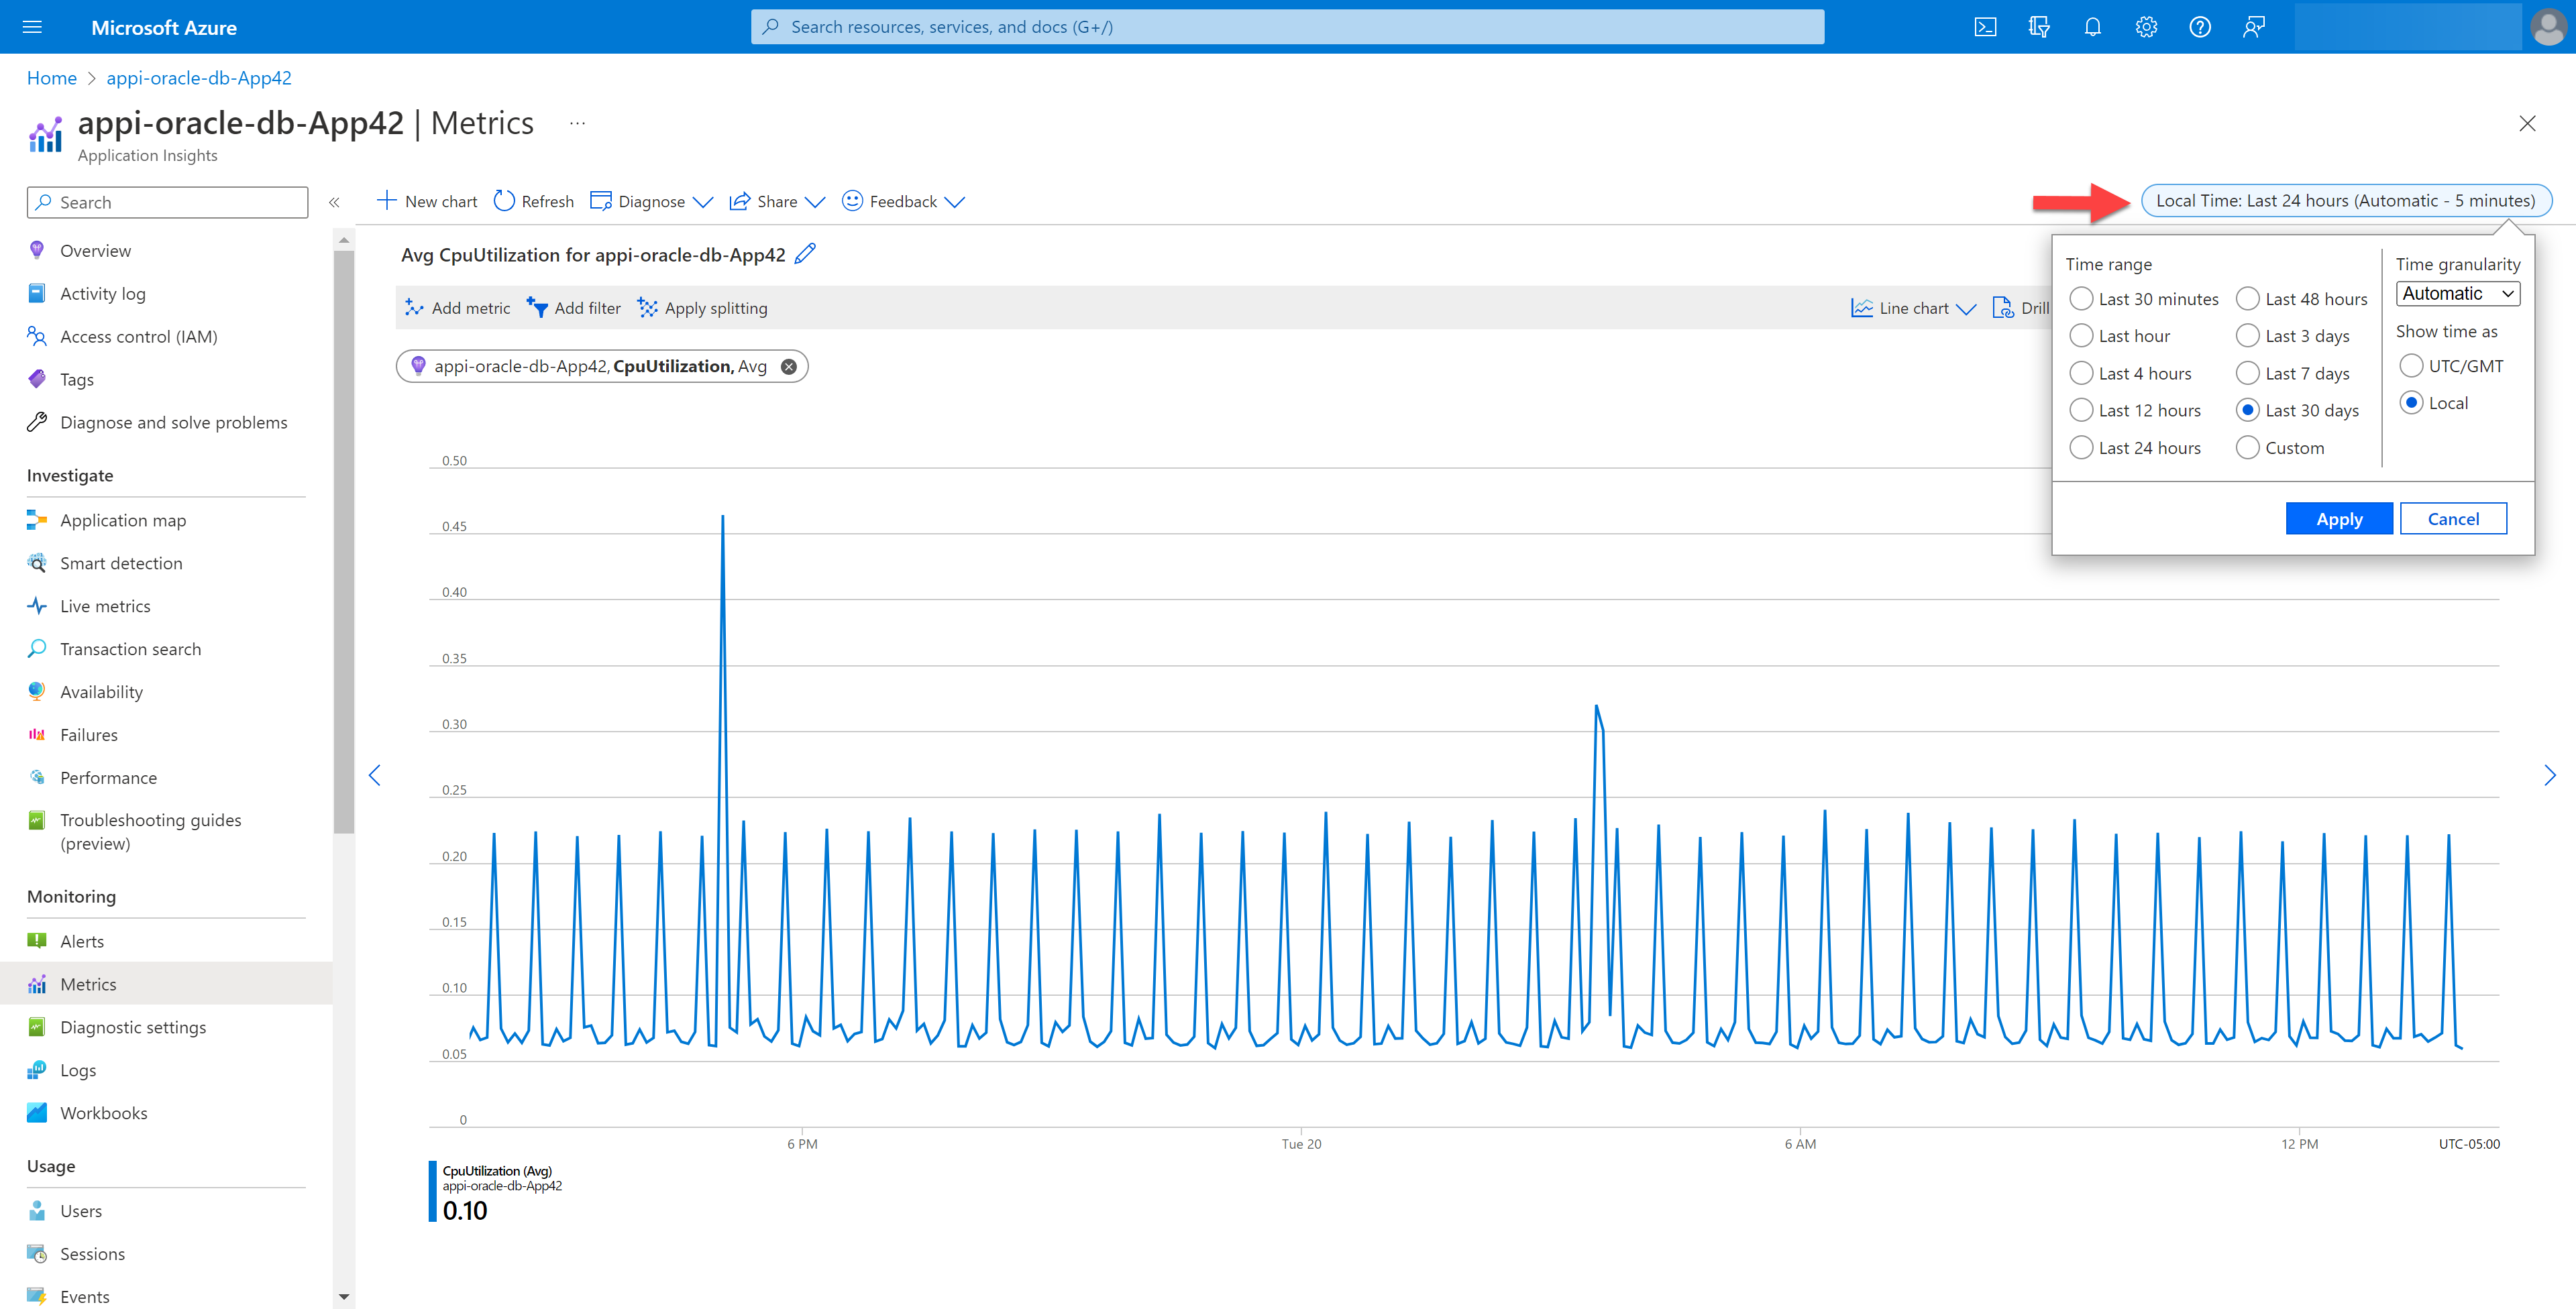
- By default, the timeframe for the metrics is the Last 24 hours. To change this, select the timeframe selector at the top-right of the Metrics blade.
- For any other issues, see the Database Troubleshooting guide.
Using Microsoft Azure for Database Metrics can be accomplished as follows:
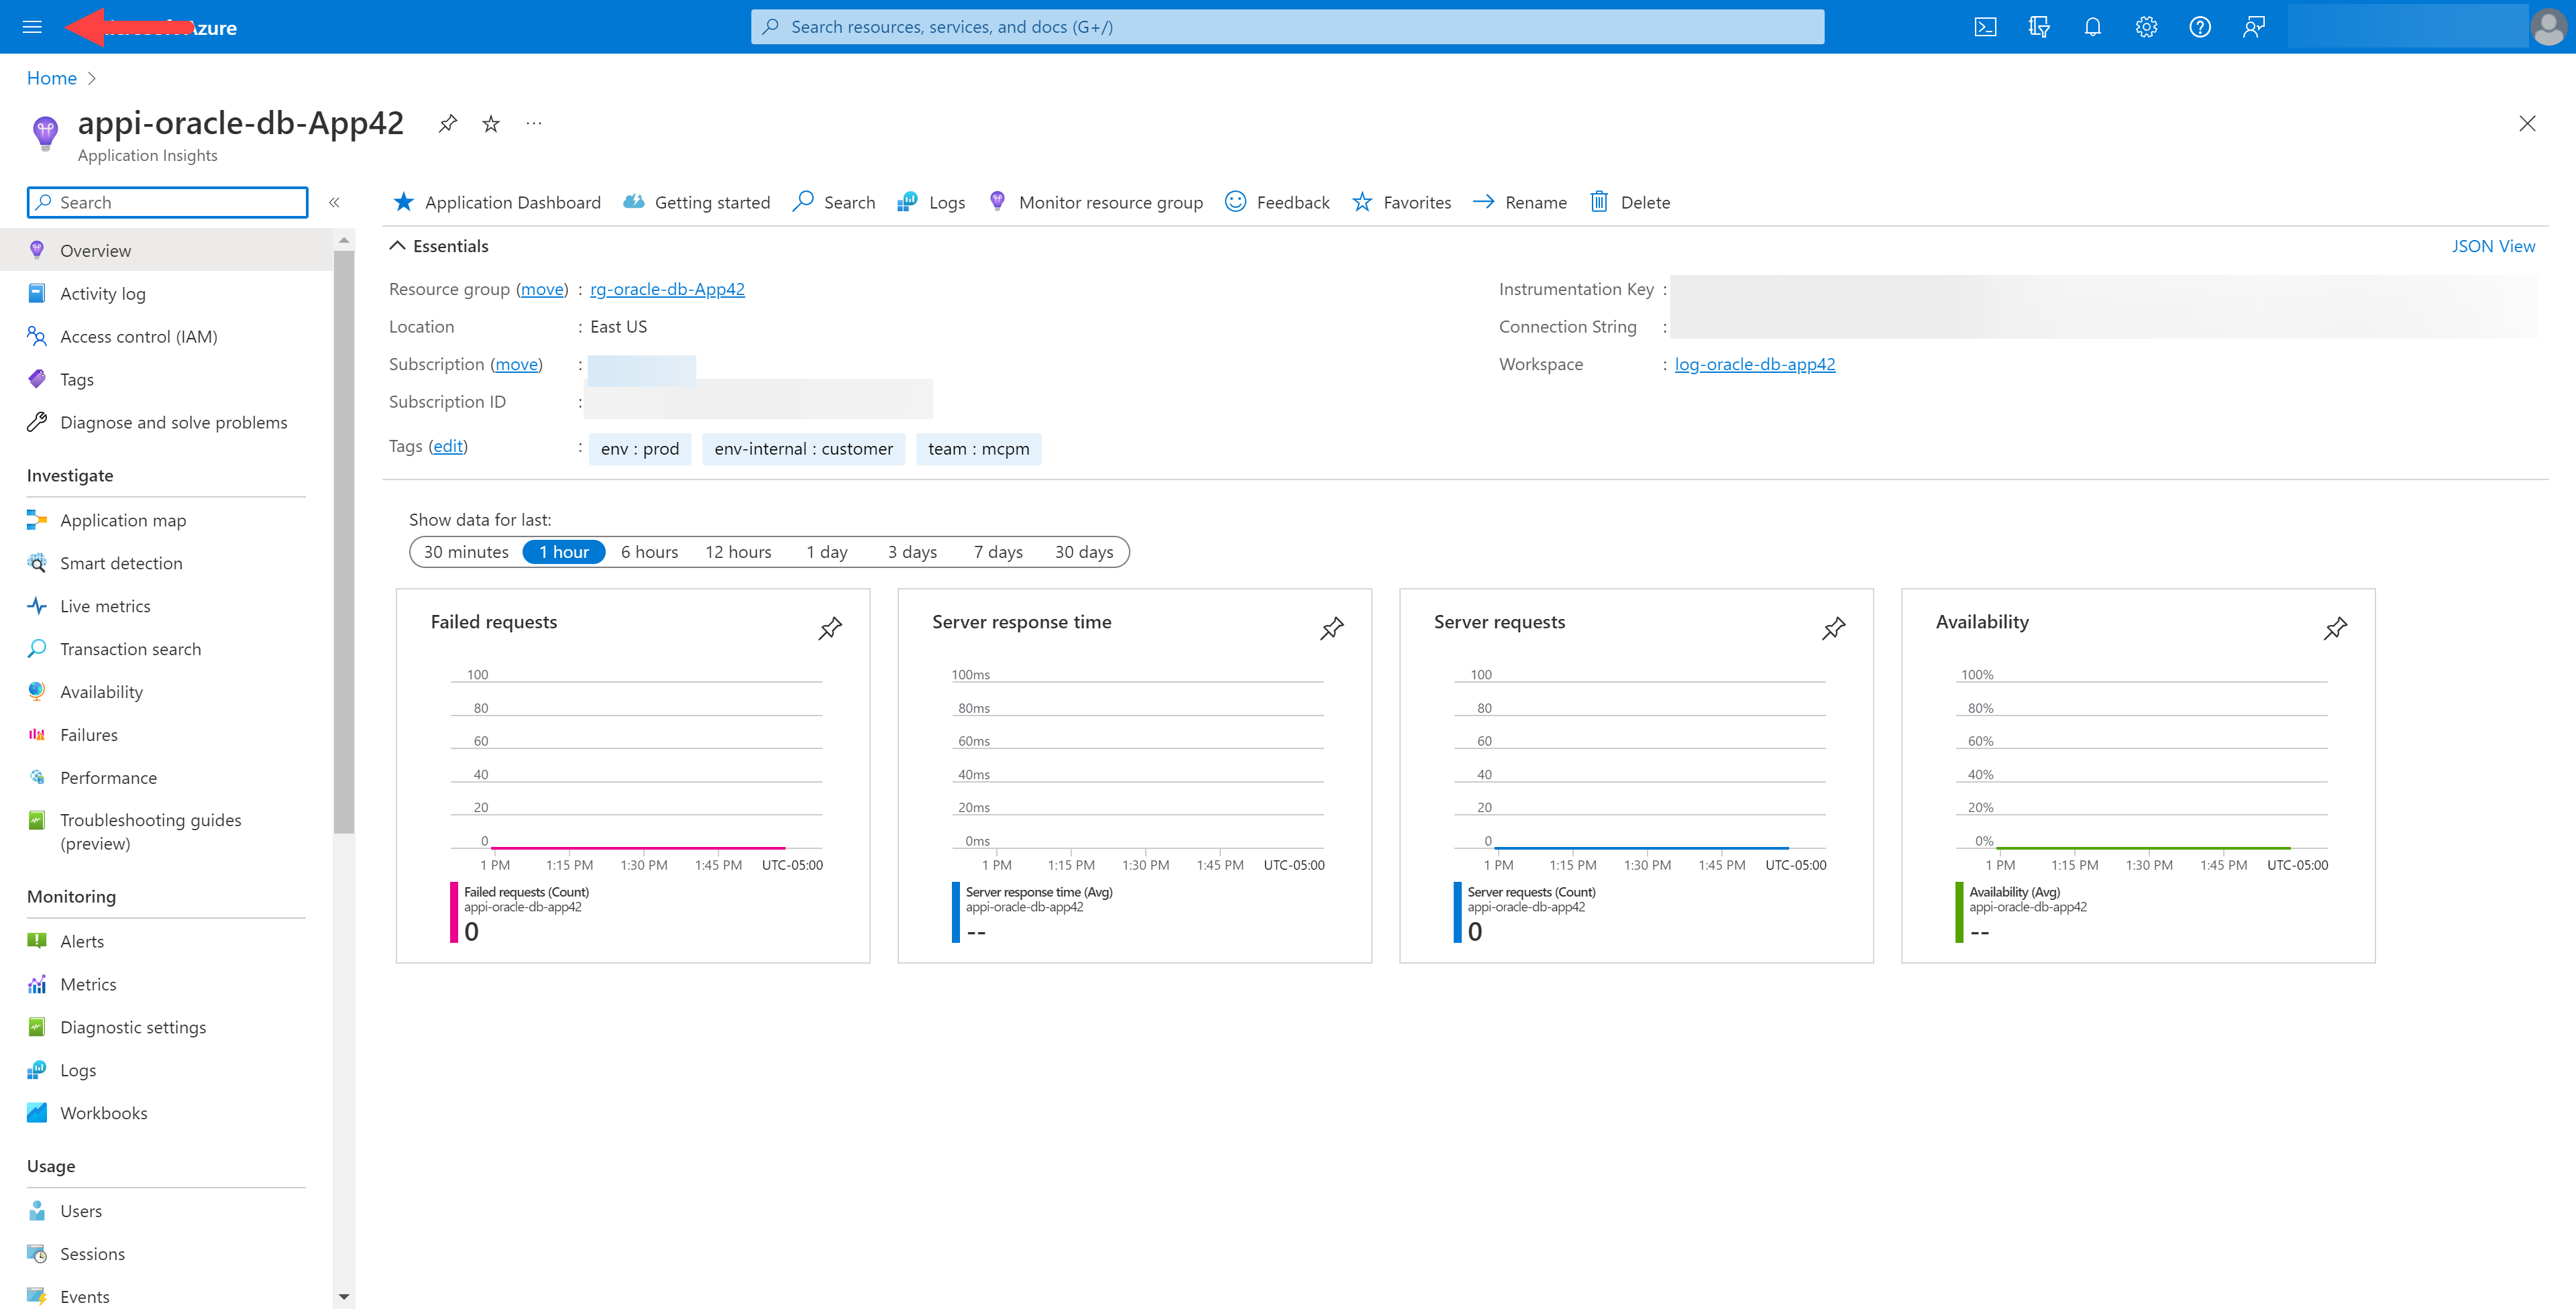
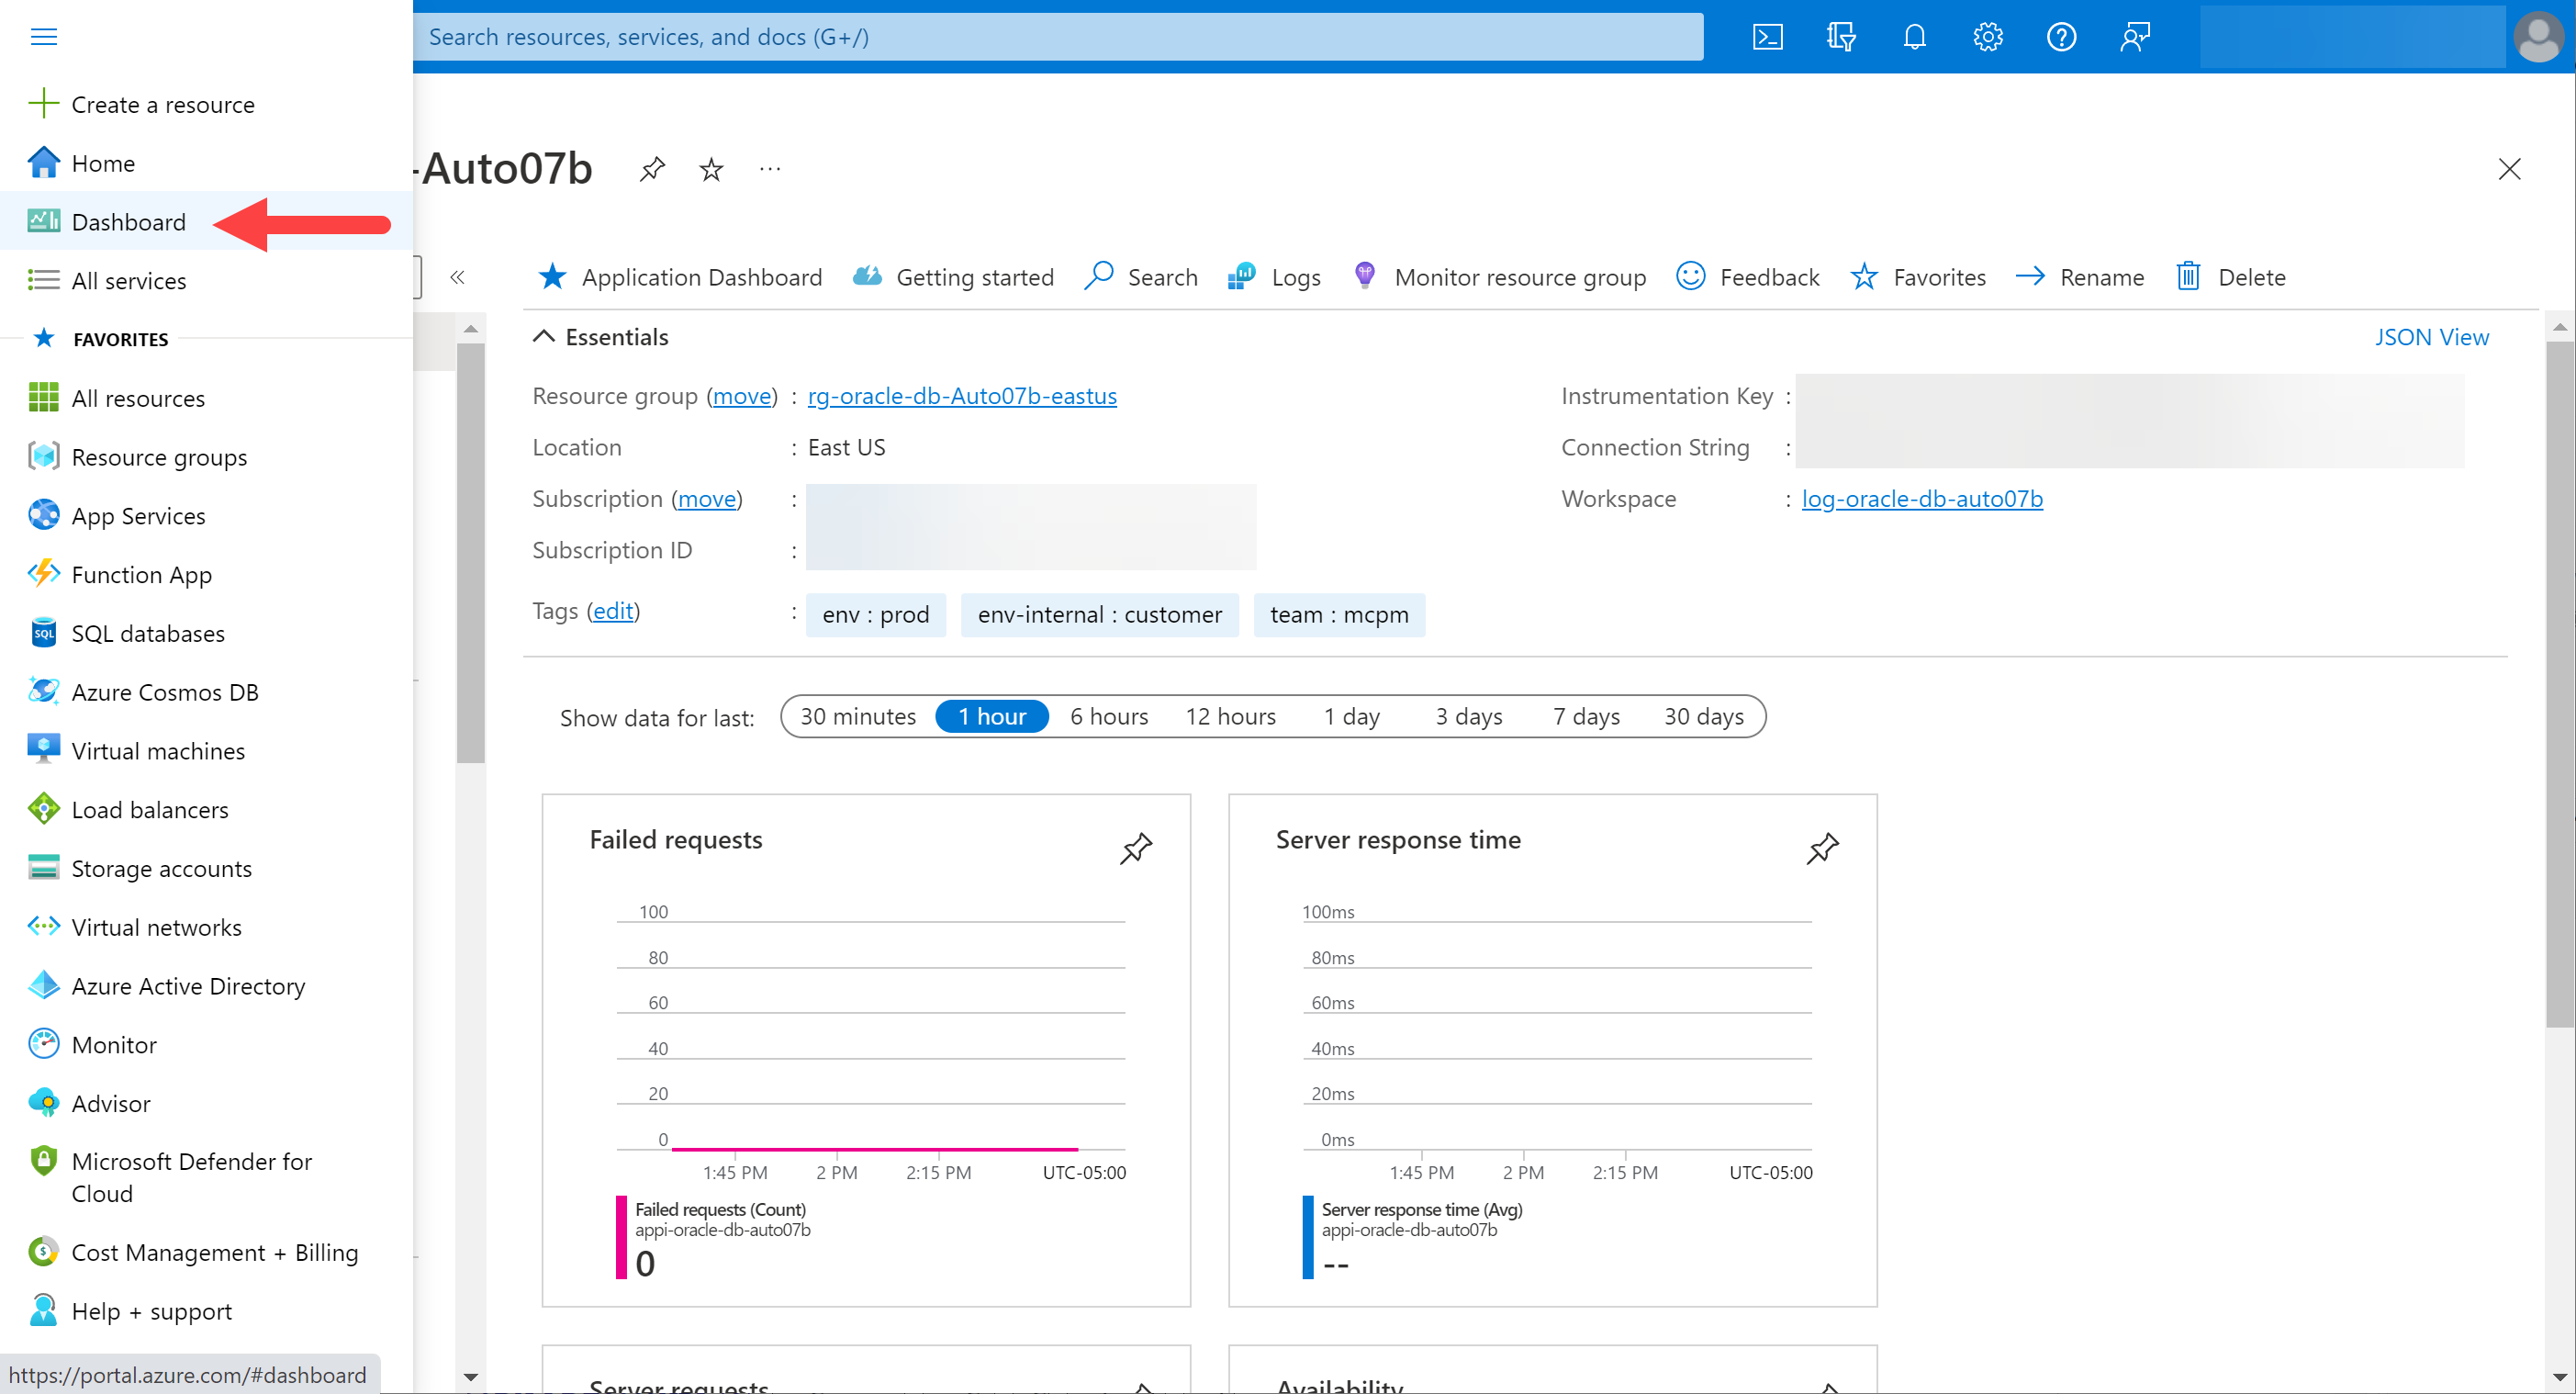
- From anywhere in the Microsoft Azure portal, select the Azure menu (hamburger) on the top-left of the page.
- From this menu, select the Dashboard entry.
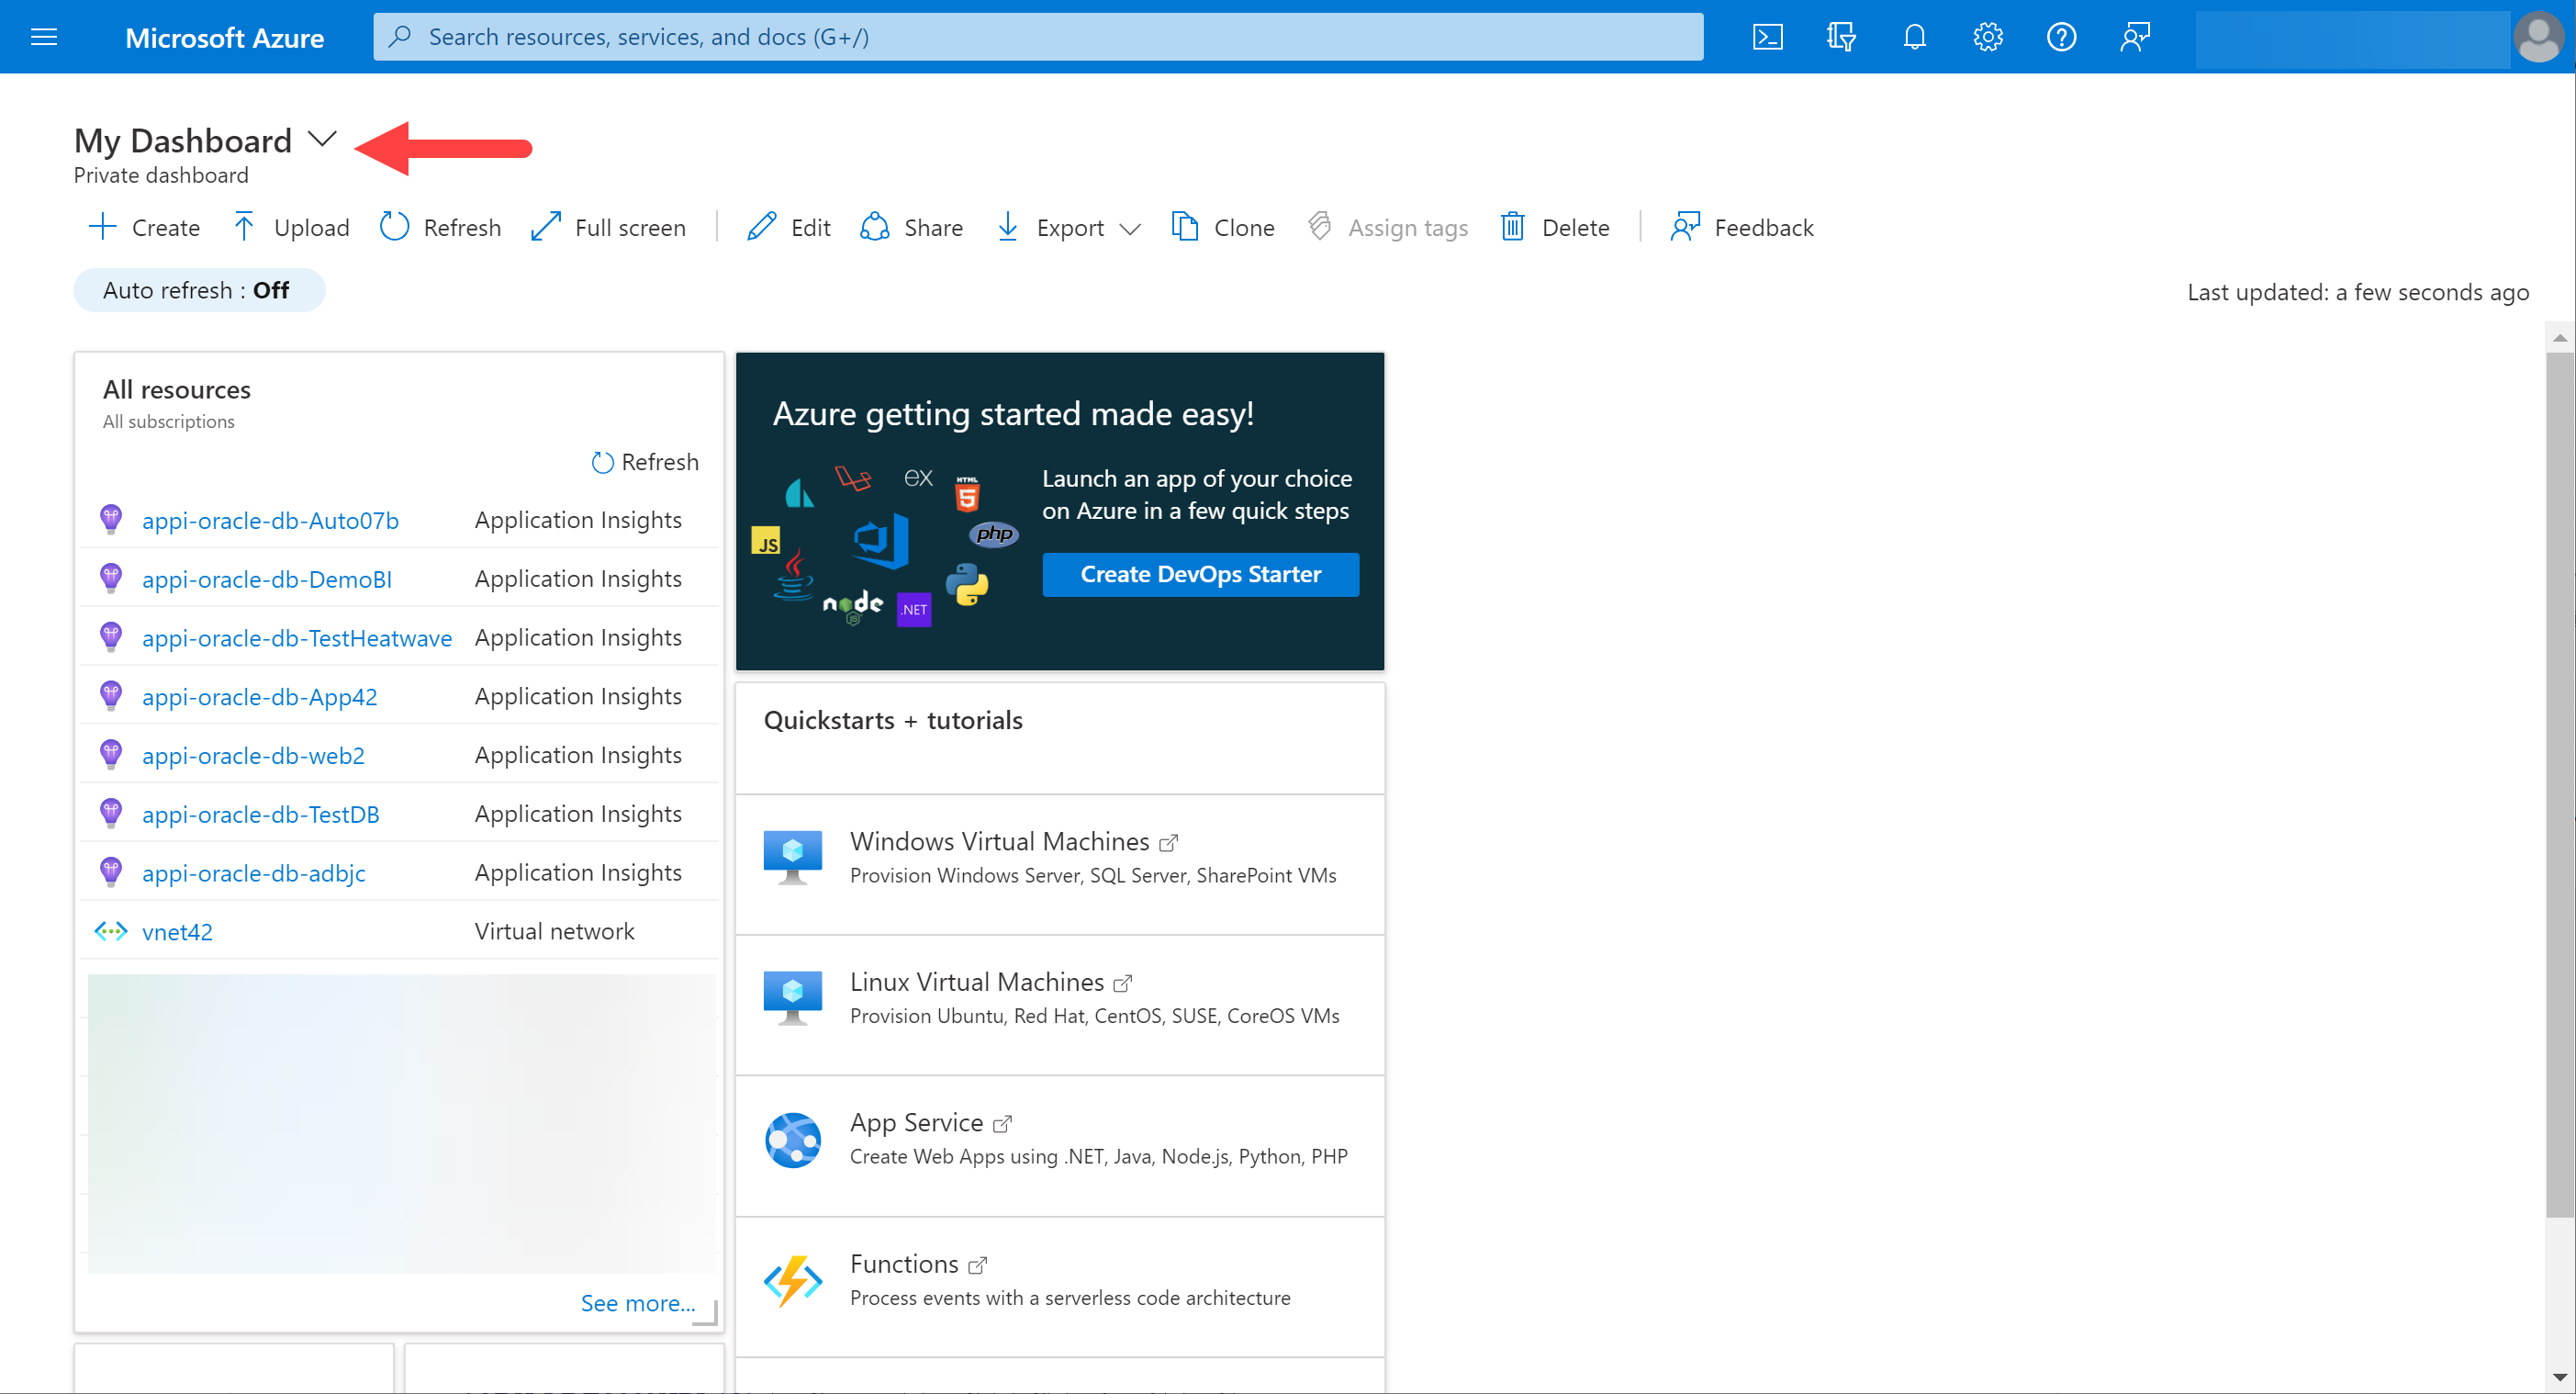
- The My Dashboard portal will open. Select the drop-down at the top.
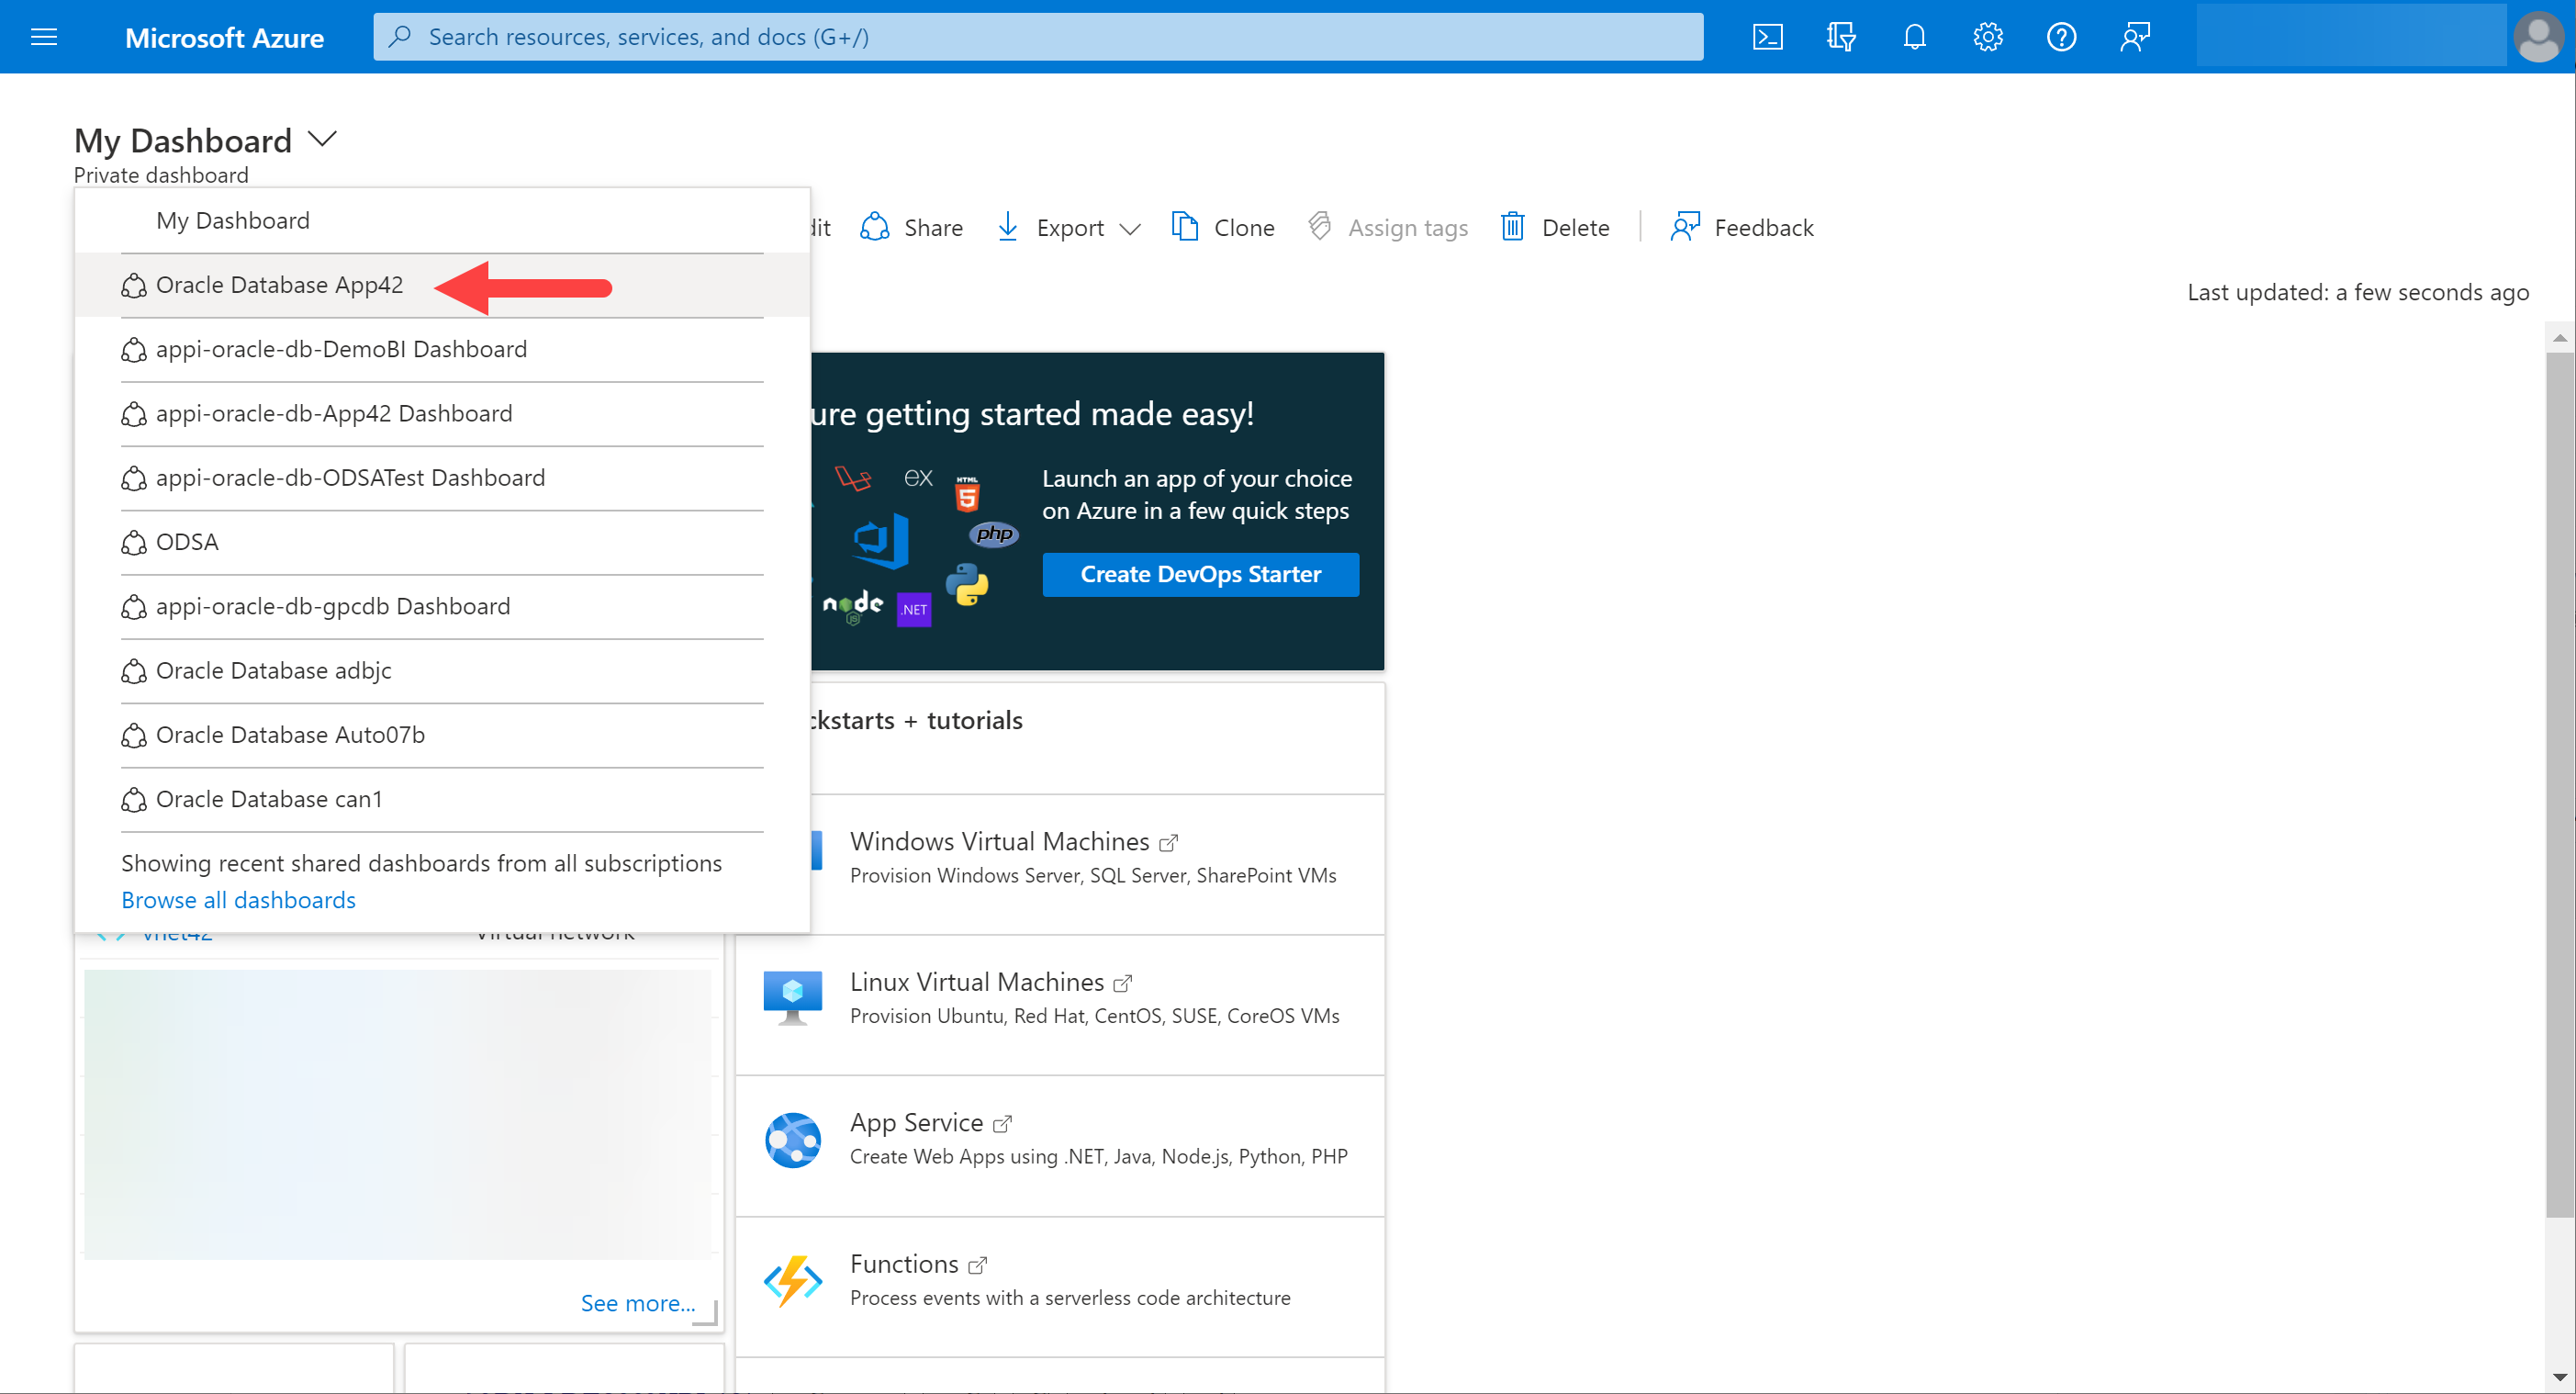
- From this drop-down, select the specific database you wish to view.
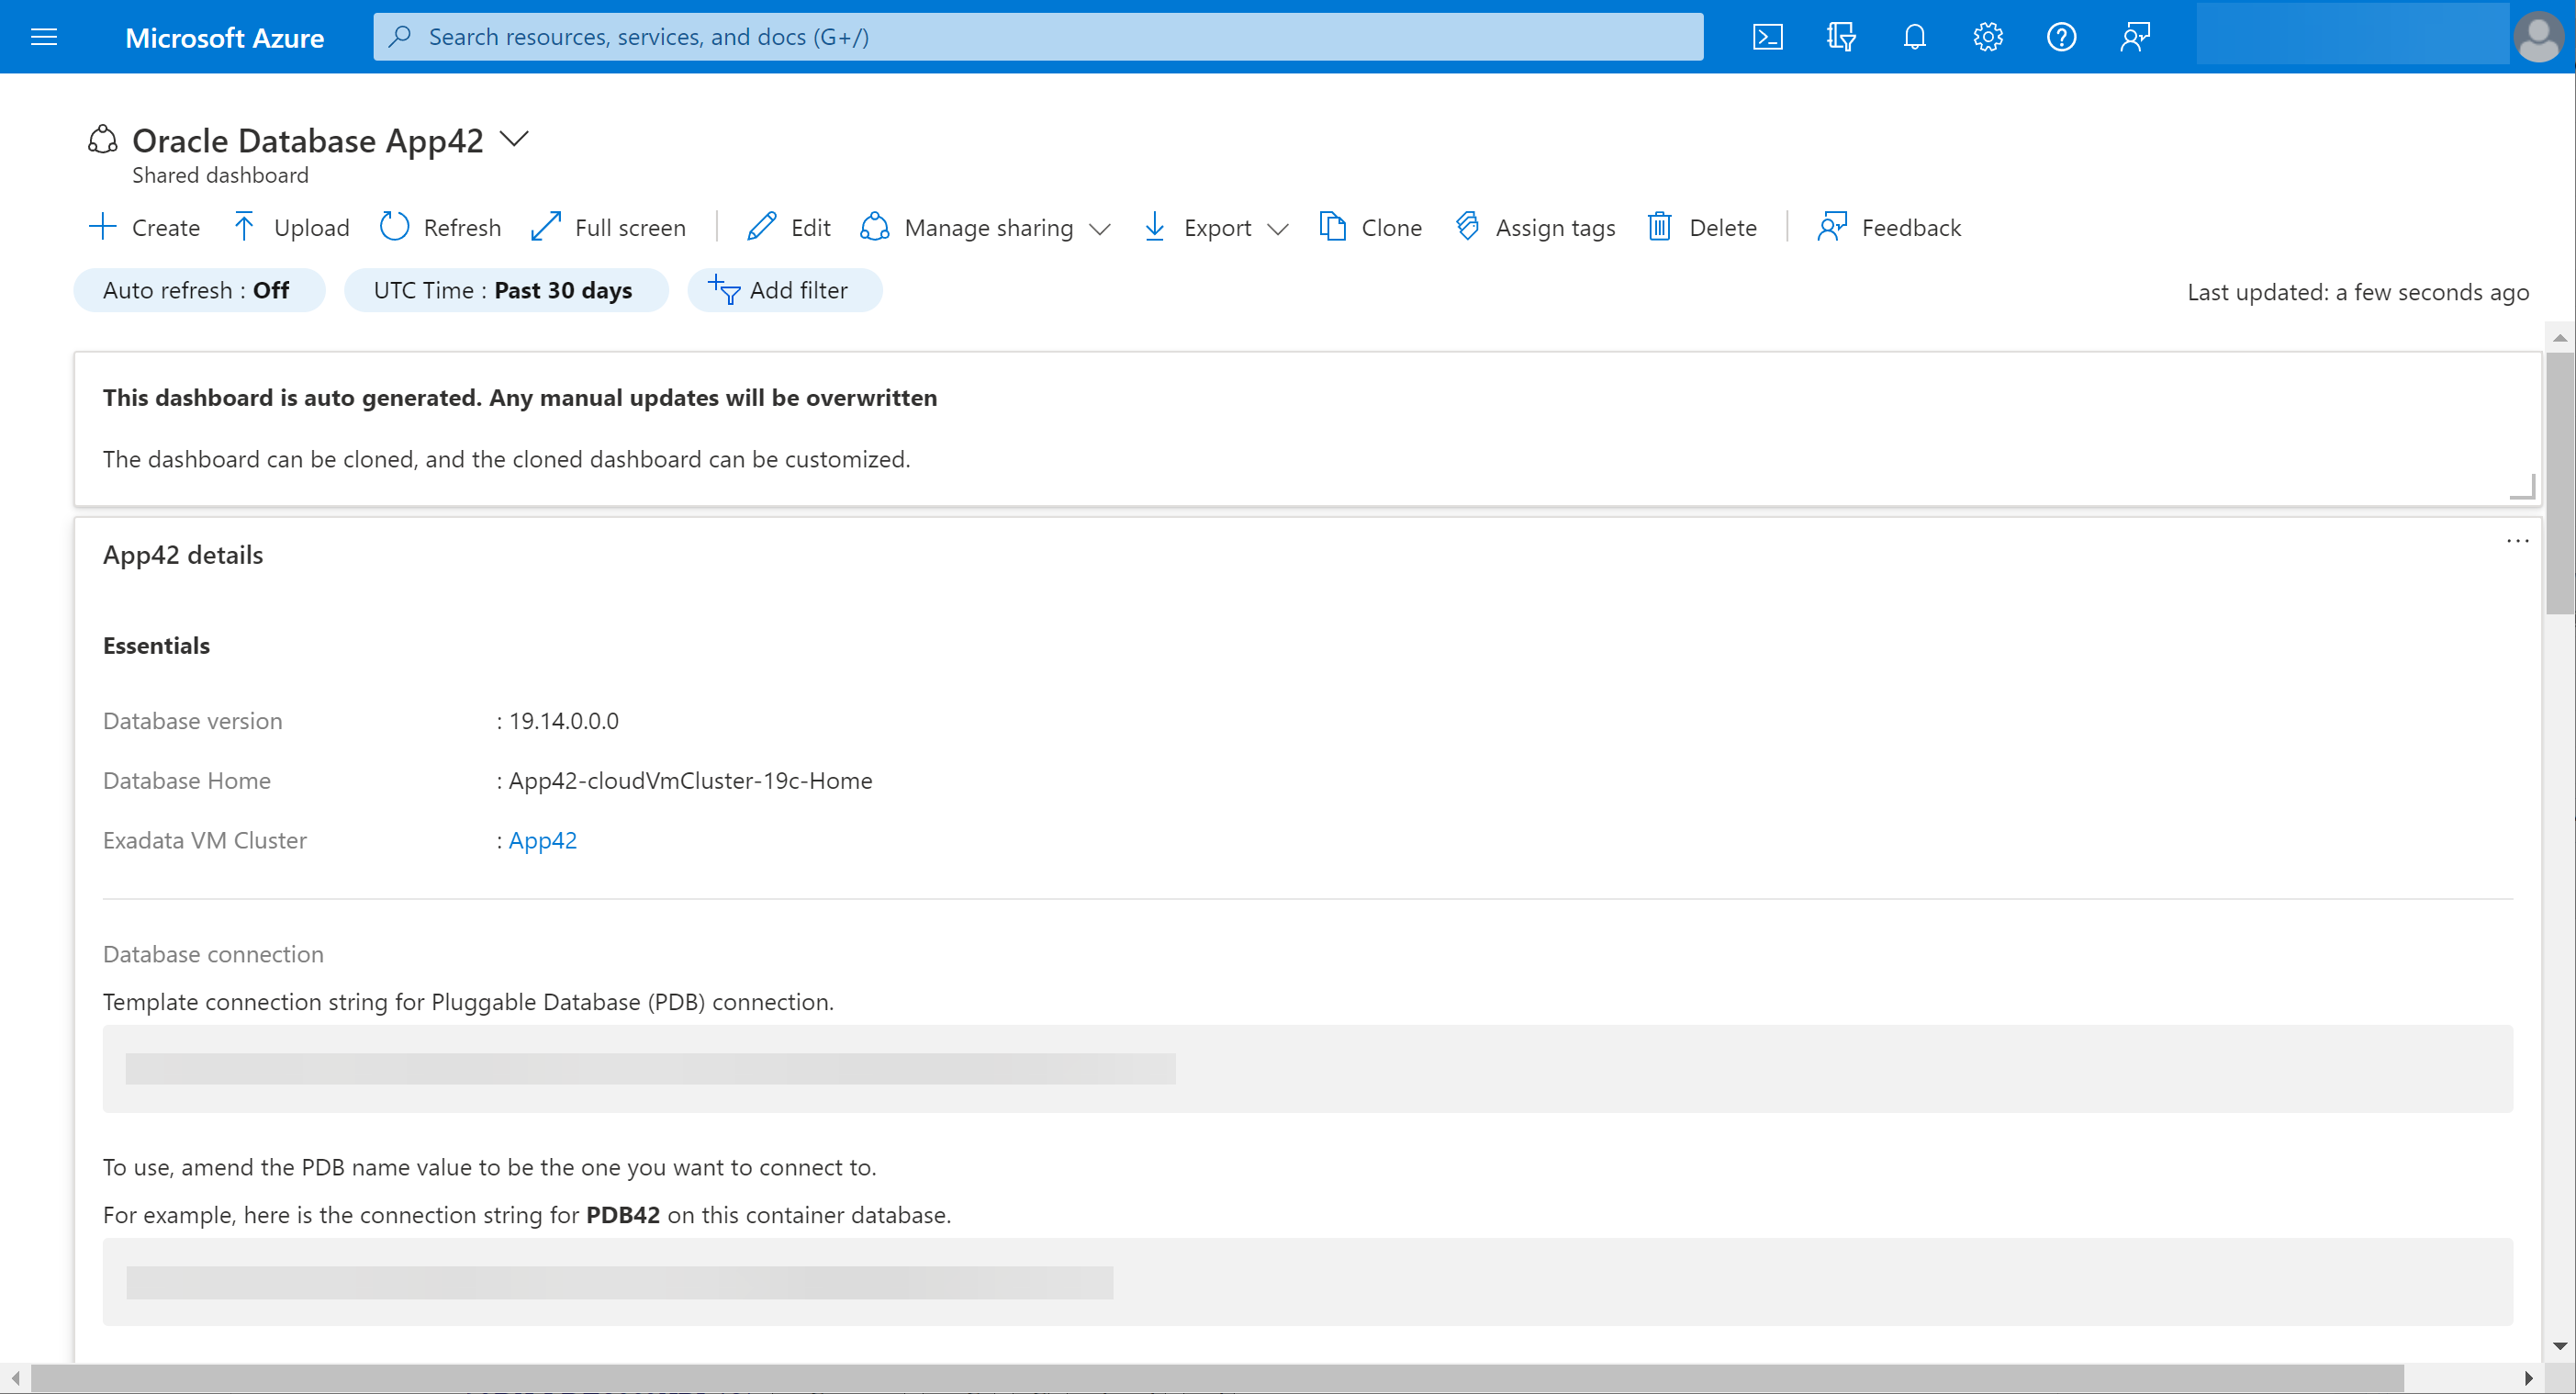
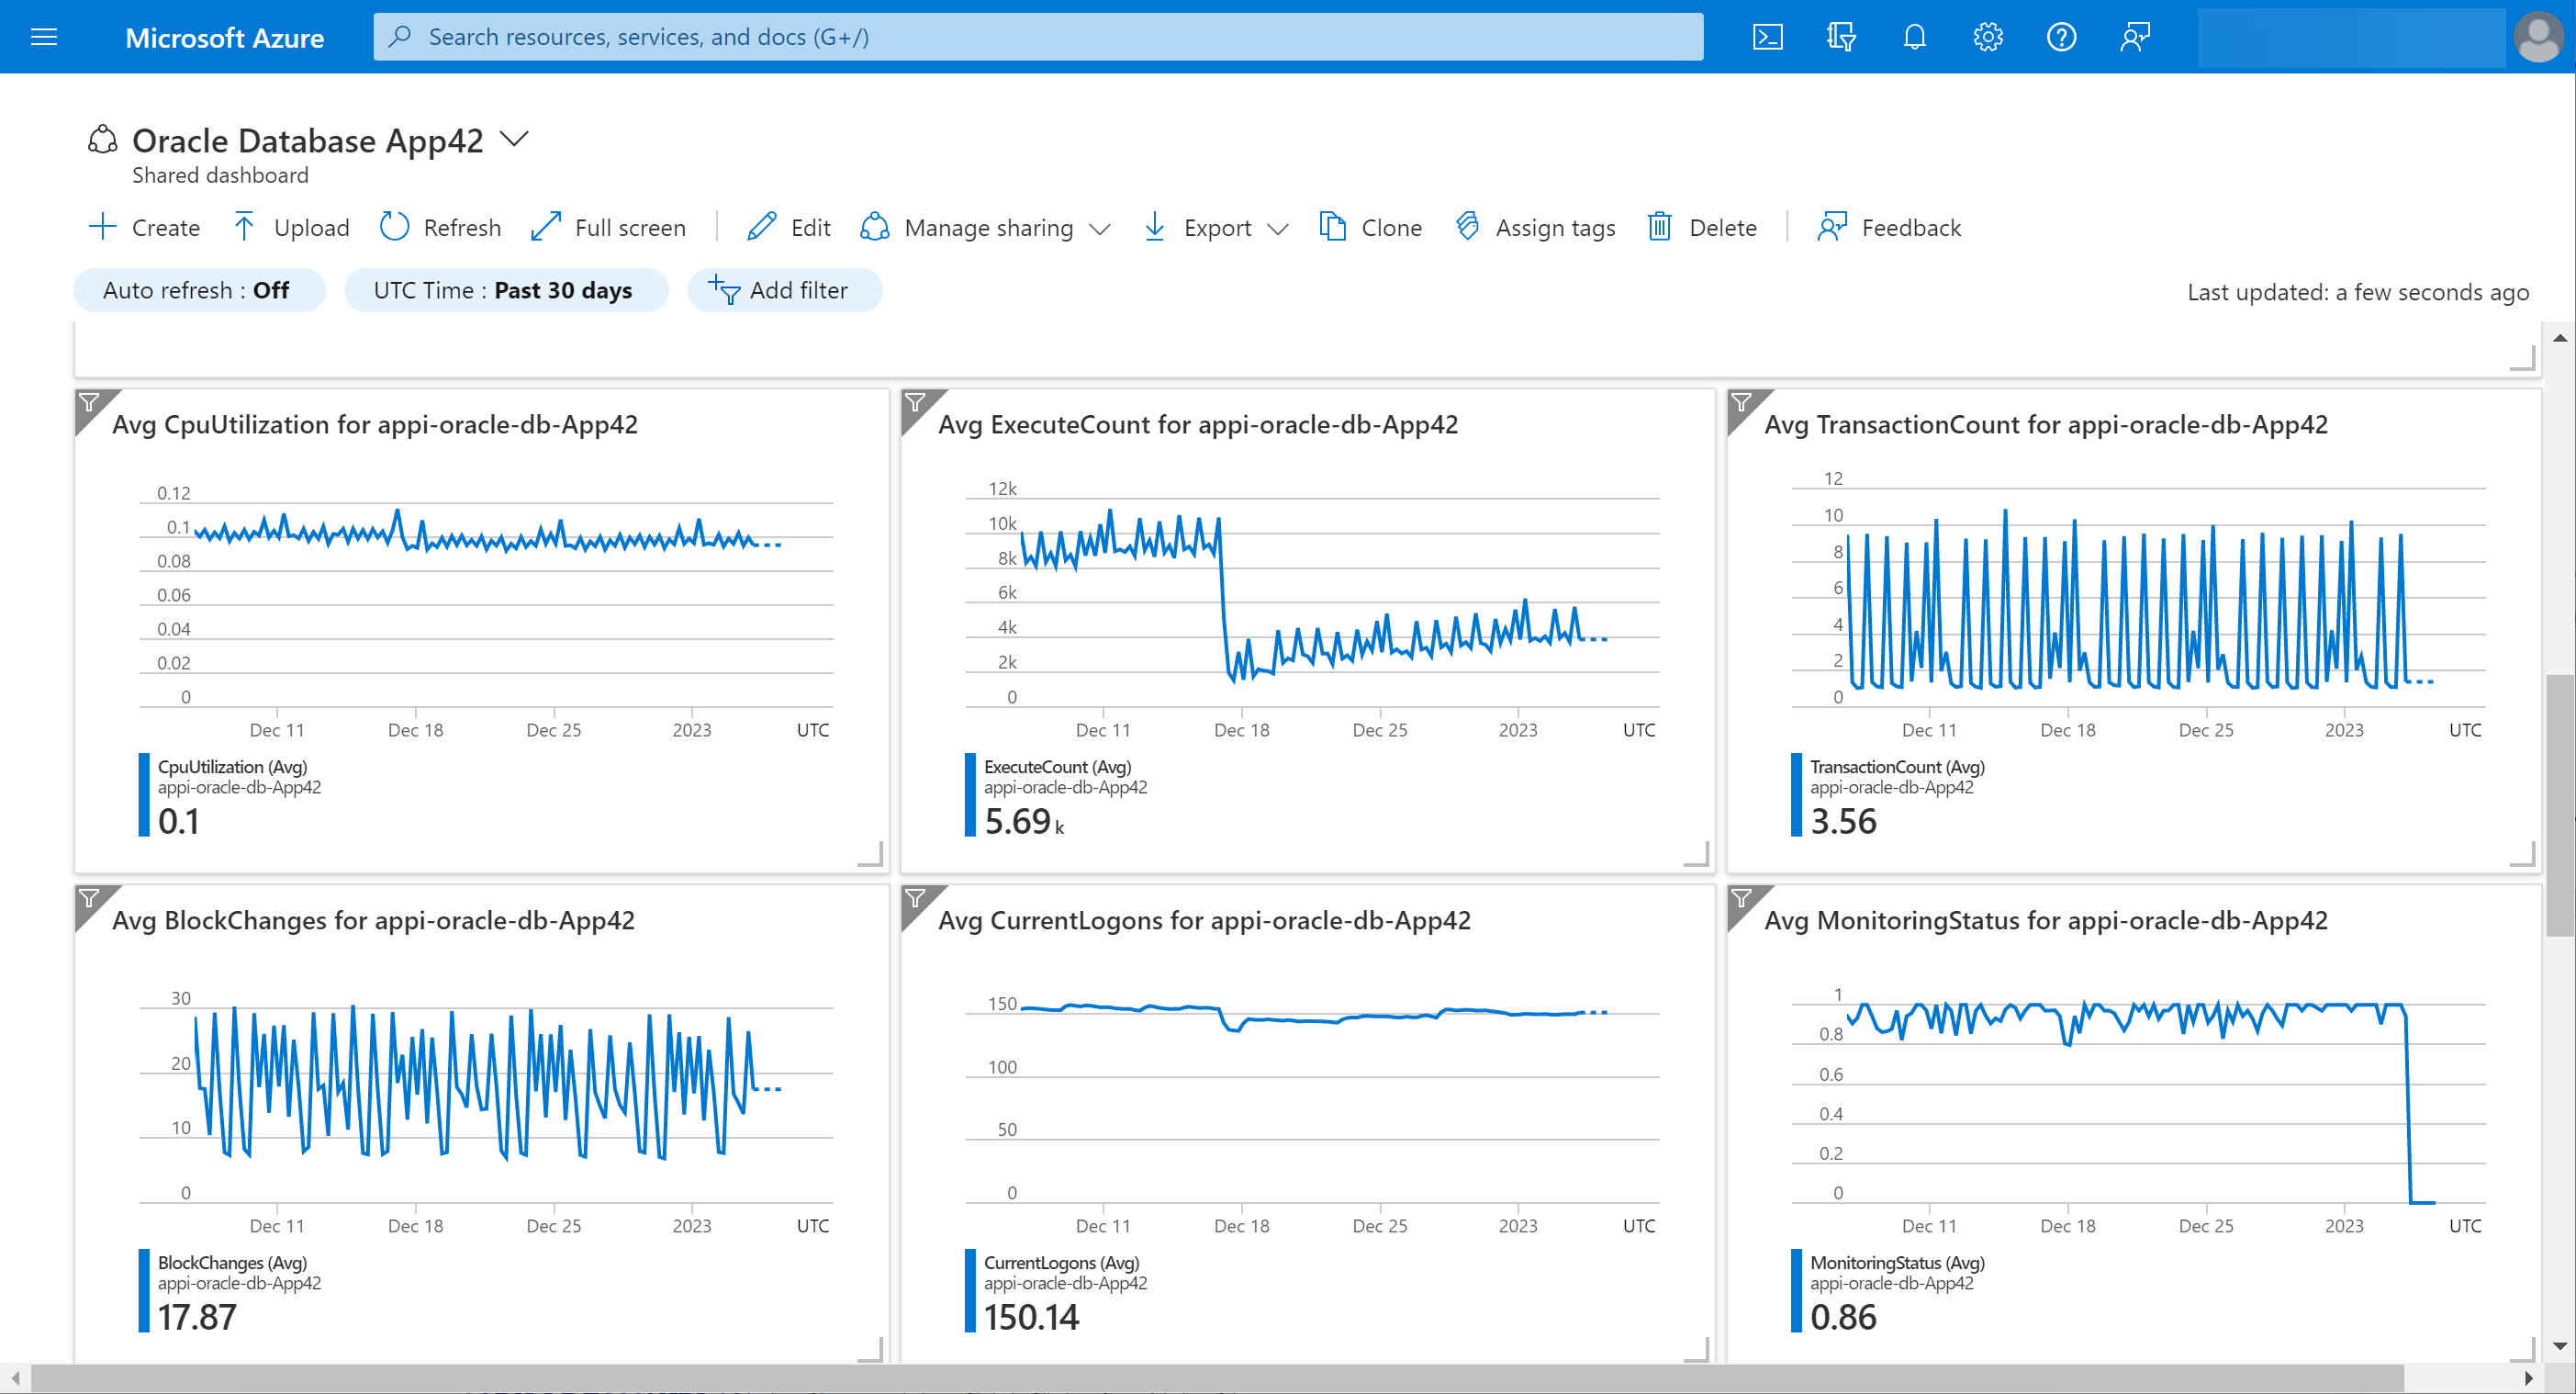
- This is the top of the dashboard that is created, in Microsoft Azure, for your database. There are lots of useful information and functions on this dashboard. For example, you can copy the connection strings required to access the database from this part of the dashboard. For the metrics, scroll down in the dashboard.
- These are the metrics presented for your database.
