Generating the Detailed Profitability Stage Balancing Report

To generate stage balancing reports:

  1. Ensure the following conditions have been satisfied:
    • Model Data is registered

    • Model Data is loaded

    • Model is calculated successssfully

  2. From Oracle Hyperion Enterprise Performance Management Workspace, select Navigate, then Applications, then Profitability, and then select the application that you want to view.
  3. In an open model, from Task Areas, select Validate, and then Stage Balancing.
  4. On the Stage Balancing screen, select the POV for the model, and then click Load the POV status Load the POV status icon.
  5. Select the type of Stage Balancing Report that you want to generate:
    • Click Stage Summary to view the summary of the balancing activity for the entire source stage.

    • From the Source Measures Dimension Members Selector, select a Source Measure to view the summary of the balancing activity for the selected Source Measure.

  6. Click Run to generate the report.

    The generated Stage Balancing Report displays the Stage Name, and values for Input, Total Output, Idle, OverDriven and Unassigned.
  7. Review the report, using one or more of these validations to verify the results:
    • Total Input – Total Output– Idle + OverDriven = Unassigned Values

    • Sum of all monetary or balance data loaded to the source stage = Input

    • Sum of unassigned values + Idle - OverDriven = Input

    • You can also launch some predefined Smart View integrations from the Stage Balancing screen. The launch data points are represented as hyperlinks in the Stage Balancing screen and present values that have been contributed from one stage to another. You can drill down further on input or allocation data. For example, you could drill-down into Unassigned costs after an allocation run, or to examine input data that was used in the same run.

  8. Optional: To print the report, from the brower menu, select File, and then Print.

Example 21-1 Adding Destination Measures to the Report

Optionally, you can select Destination Measures from a popup dialog member selector. In that case, a Destination Measures table is added, which displays the summed values of measures from the destination table (Figure 21-1).

Figure 21-1 Detailed Profitability Stage Balancing Report with Destination Measures Table
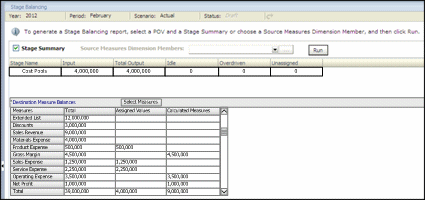

The Destination Measures table shows information about measures that contribute to the main stage balancing data, as described in the following paragraphs.

The first column shows all the measures selected. Their order enables the table to read like a Profit and Loss statement since the computations for calculated measures can follow the sequence of measures from top to bottom.

The second and third columns isolate the values of measures that were targets or assignments and calculated measures. This enables users to compare the sum of assigned values more easily to the stage balancing summary section. With this feature, users can emulate stage to stage balancing.