Runtime Metrics (Status, User Count, and Performance)
You can use Cloud Control to monitor the status of all members of the JD Edwards domain. Cloud Control can also monitor the performance of these JD Edwards EnterpriseOne servers:
Enterprise Server
HTML Web Server
On the Members for JDE EnterpriseOne Domain form, you can view the following details for each member:
Status
Alerts
Policy Violations
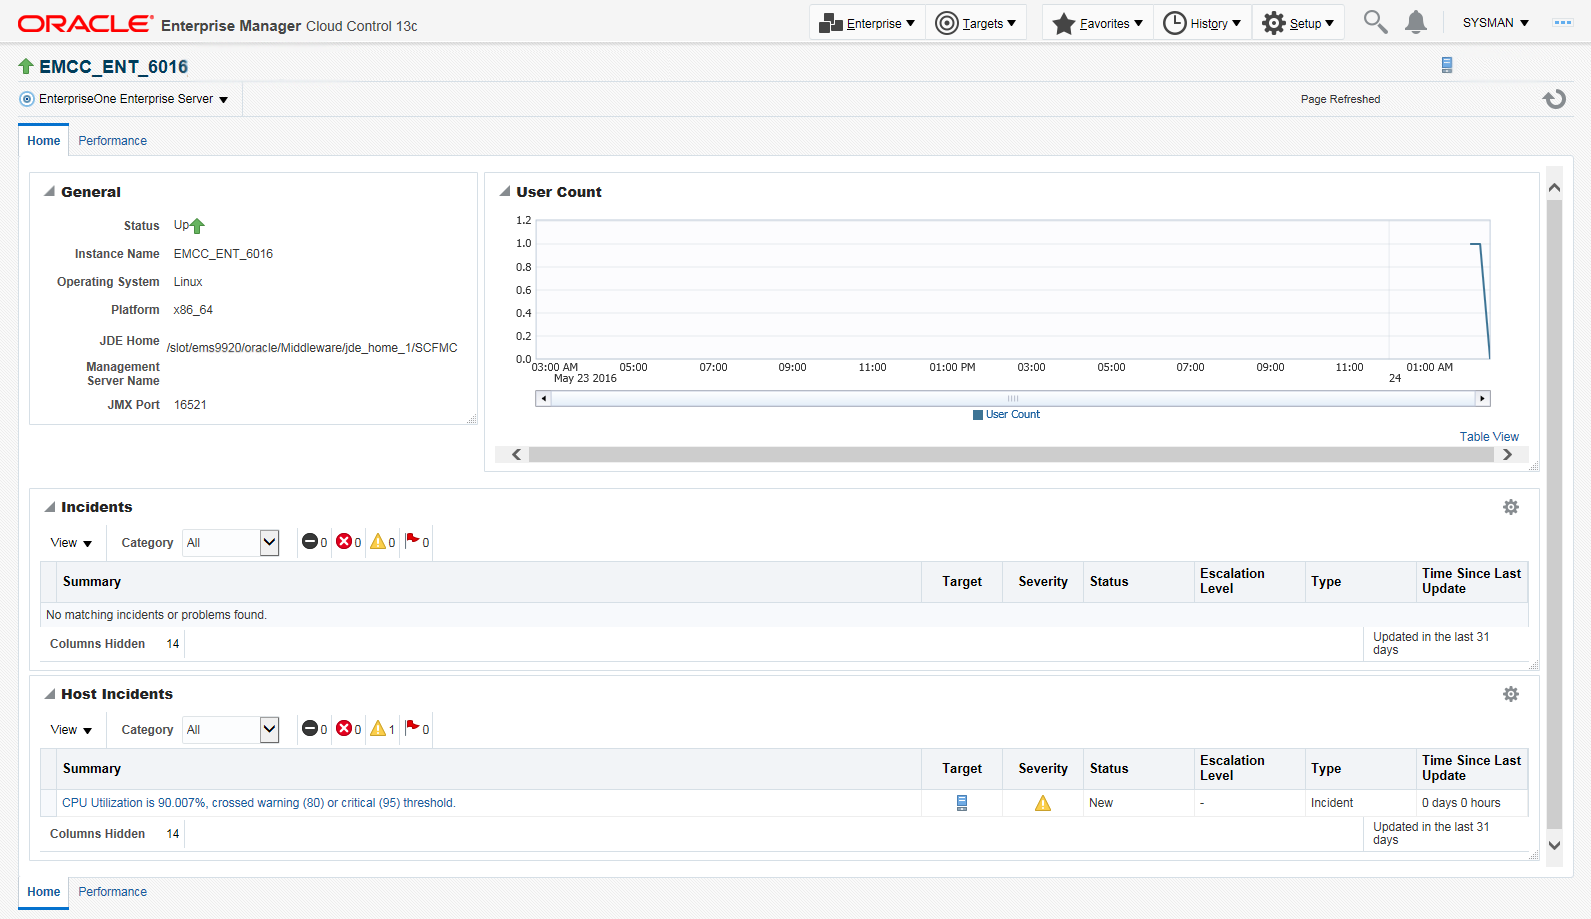
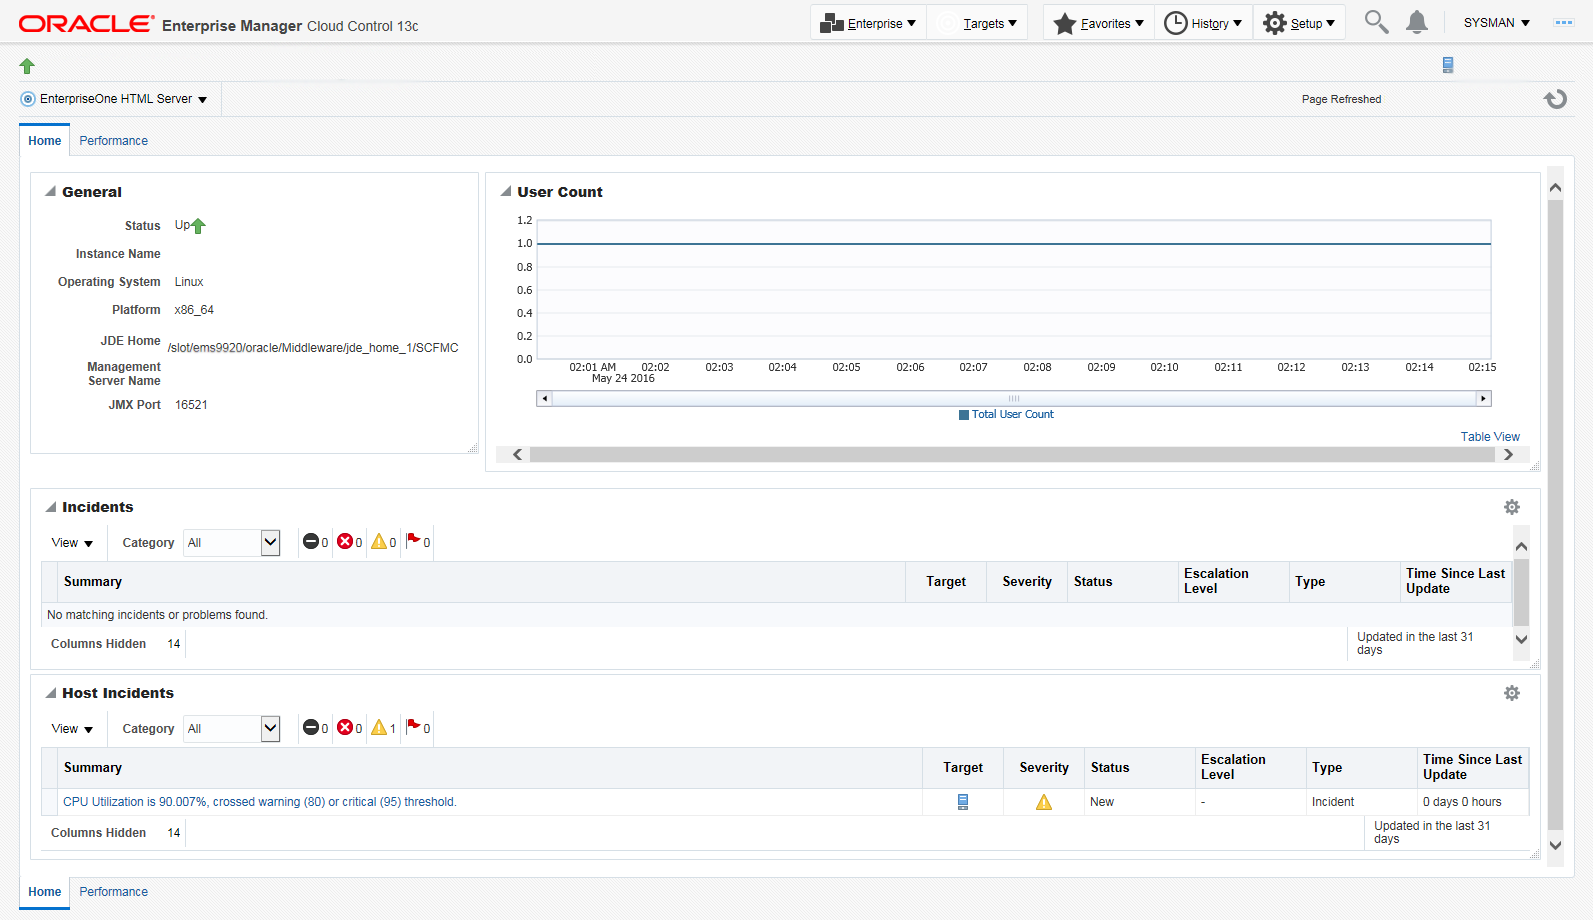
For EnterpriseOne Enterprise Server and EnterpriseOne HTML Server member types, you can view the following performance data:
Home tab
General
User Count
Incidents
Host Incidents
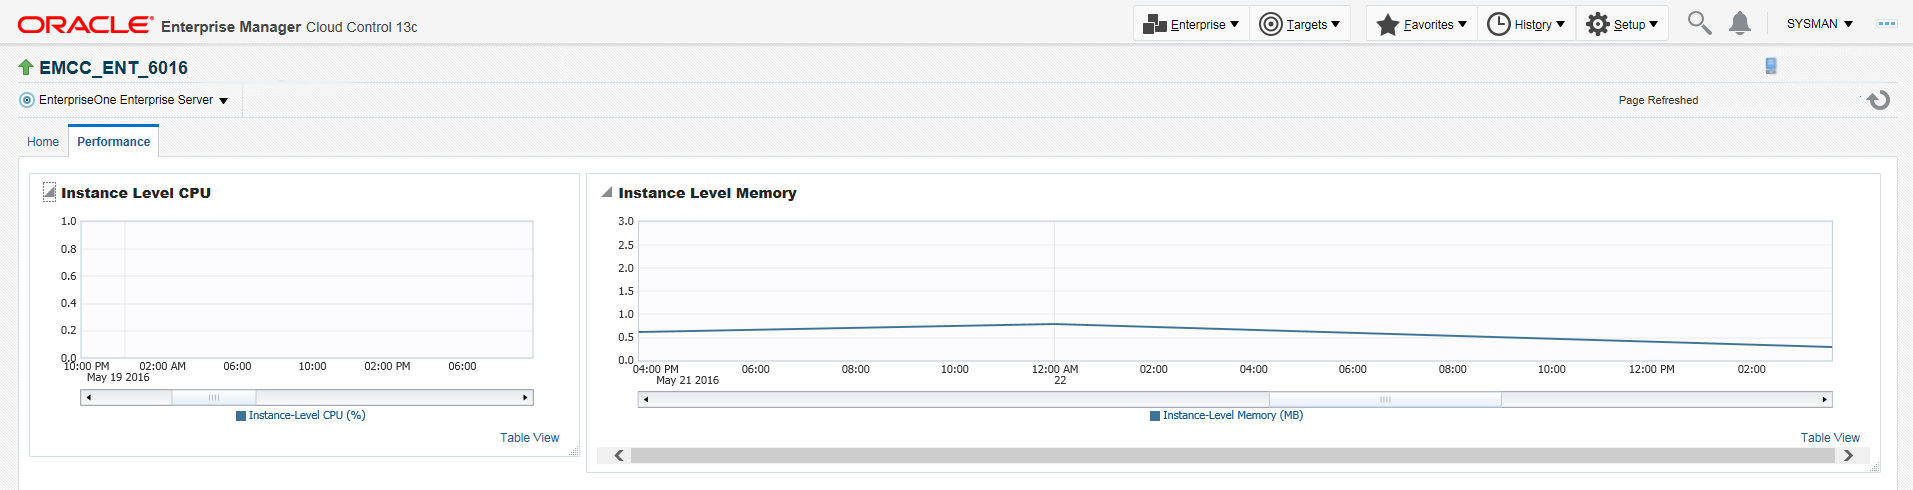
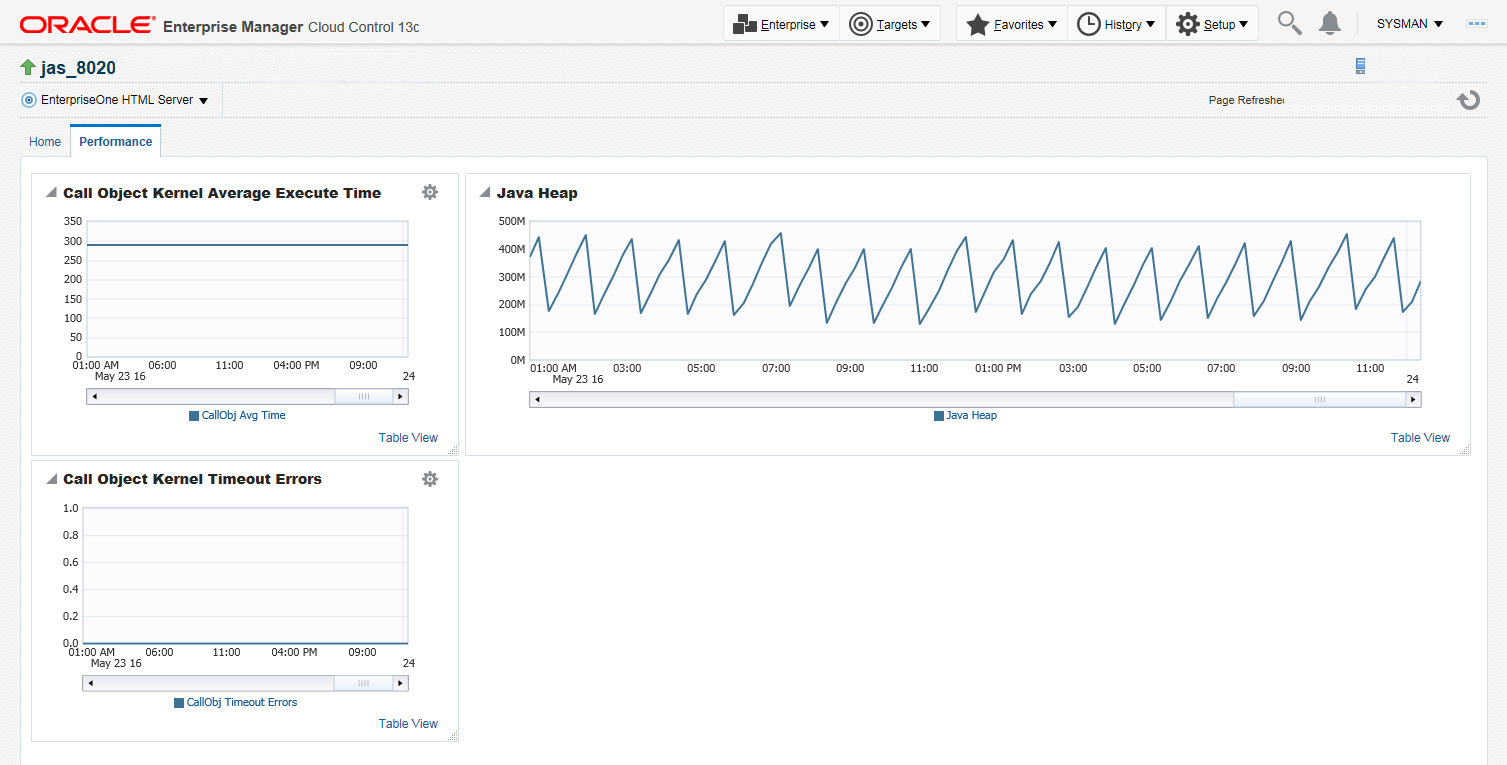
Performance tab
Call Object Kernel Average Execute Time
Java Heap
Call Object Kernel Timeout Errors
Instance Level Memory
Instance Level CPU
Following are examples of the Home tab for each JD Edwards EnterpriseOne Server Type (Enterprise Server and HTML Server, respectively).
Following are examples of the Performance tab for each JD Edwards EnterpriseOne Server Type (Enterprise Server and HTML Server, respectively).
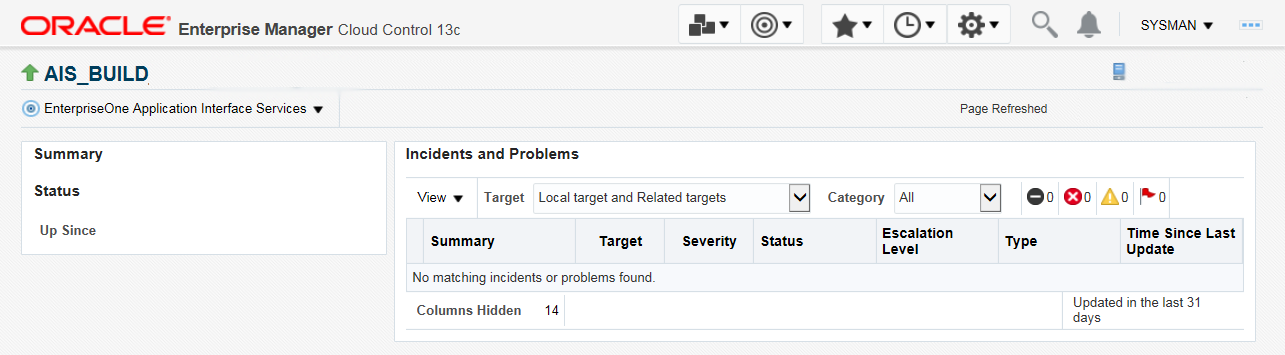
For the Application Interface Services Server, the following runtime metrics are displayed:
Summary
Status
Incidents and Problems
Following is an example of the home page for the Application Interface Services Server.