Viewing All Metrics for JD Edwards Oracle Database Server
Use this procedure to view all metrics for the JD Edwards Oracle Database Server.
On Members for JDE EnterpriseOne Domain, click the link for the Name for the Oracle Database Server.
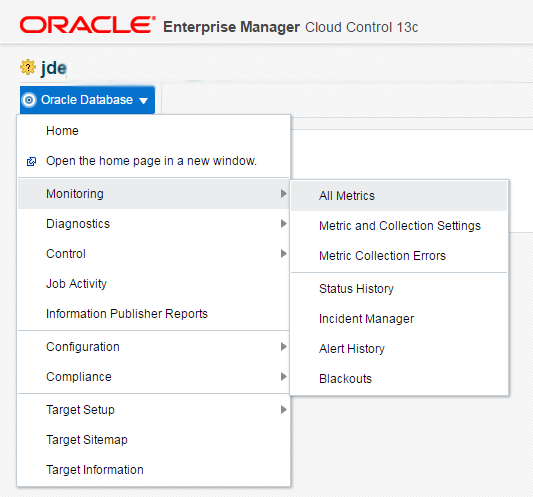
With the JDE EnterpriseOne target displayed in Cloud Control, navigate to Oracle Database, Monitoring, All Metrics.
On the All Metrics form, you can view any of the metrics that are available for the JD Edwards EnterpriseOne Oracle Database Server. These metrics include:
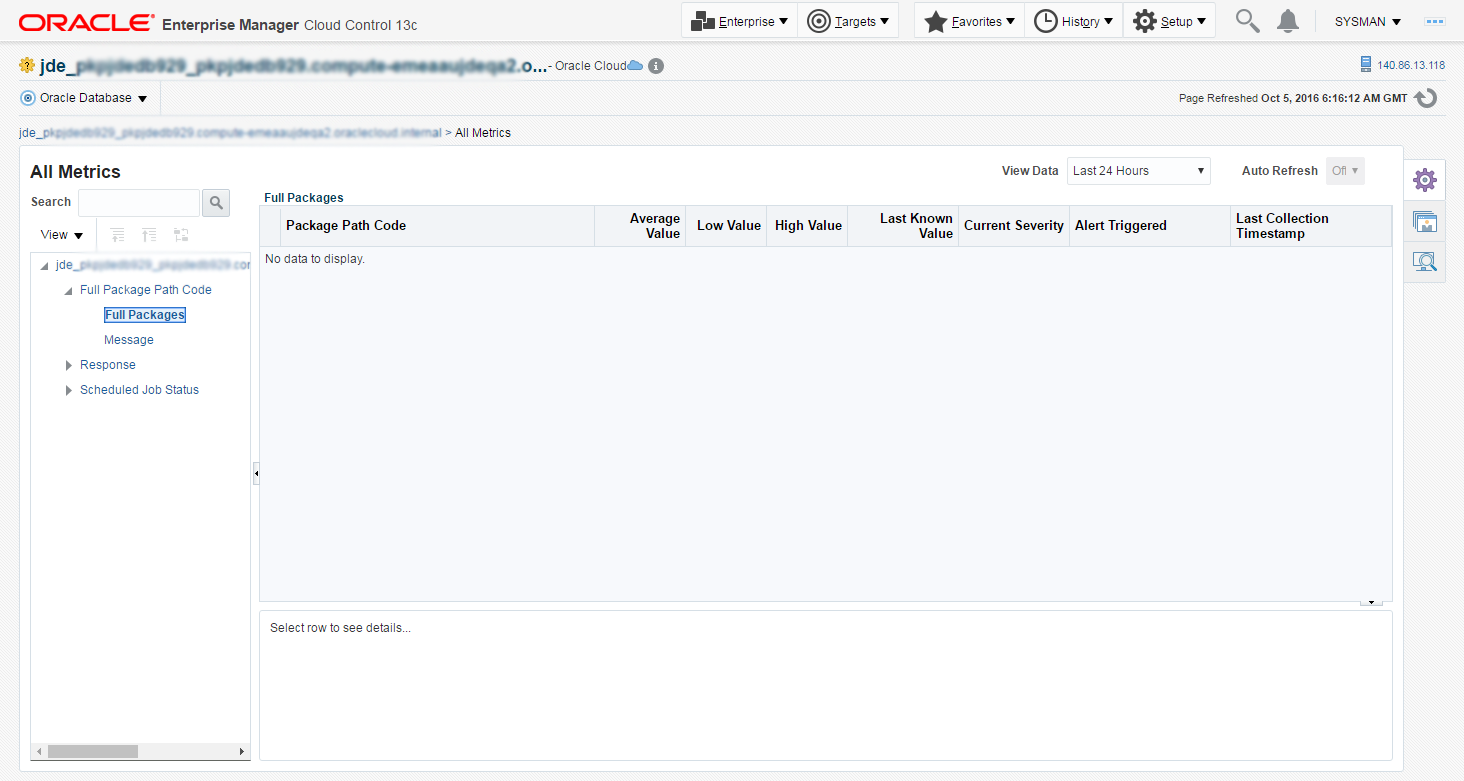
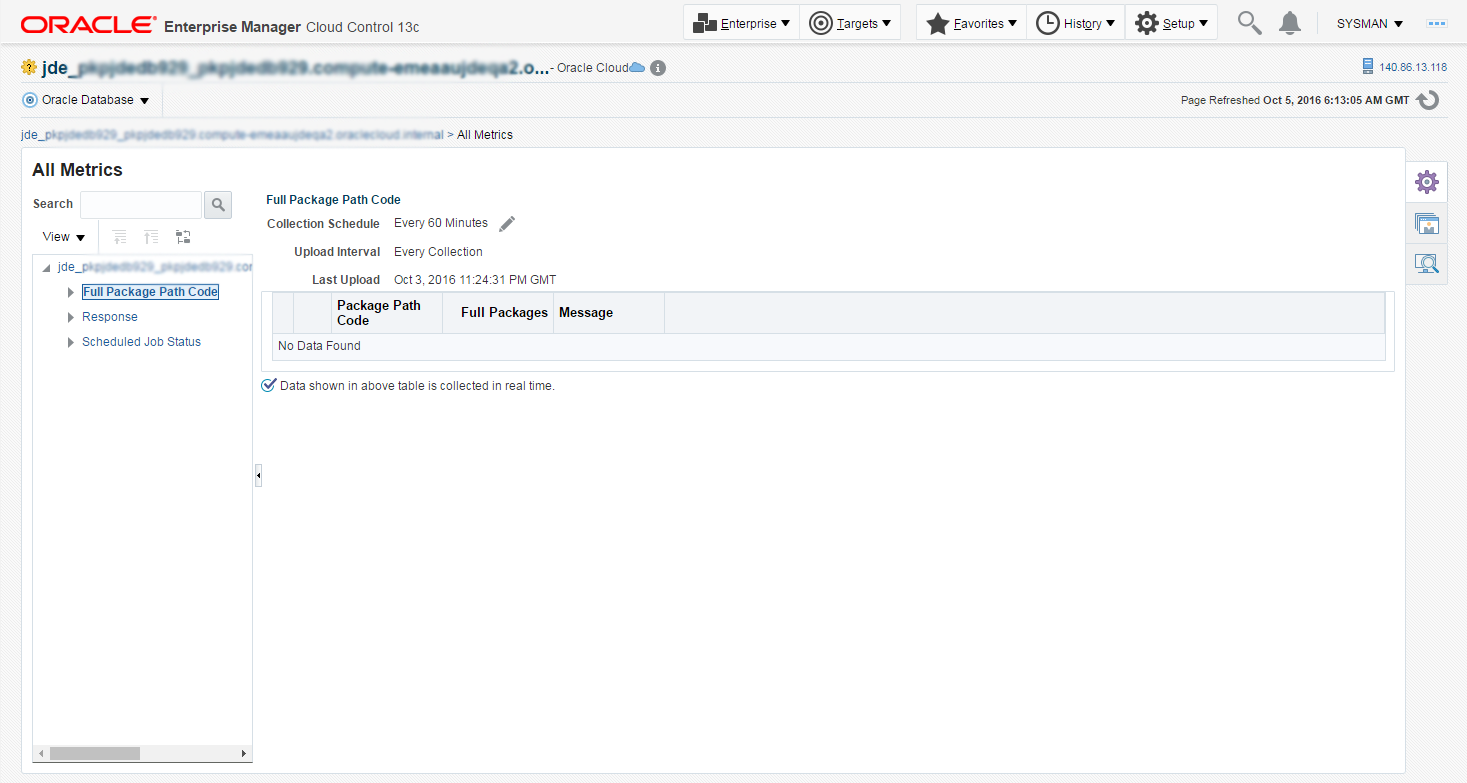
Full Package Path Code
Response
Scheduled Job Status
You can expand a metric node to view its subnodes. The following screen is an example of the metrics when you click the Full Package Path Code node.
You can also click the subnodes to display additional information. The following screen is an example of the metrics shown when you click the Full Package subnode of the Full Package Path Code node.