General Information Page
The enterprise server will have an individual process page for all E1 processes. There are several new data items as displayed in the graphic and table below.
The information is collected every 20 seconds. However, new data is presented only when the screen is refreshed.
The individual process page begins with a General Information section. The relevant information for the process selected is presented.
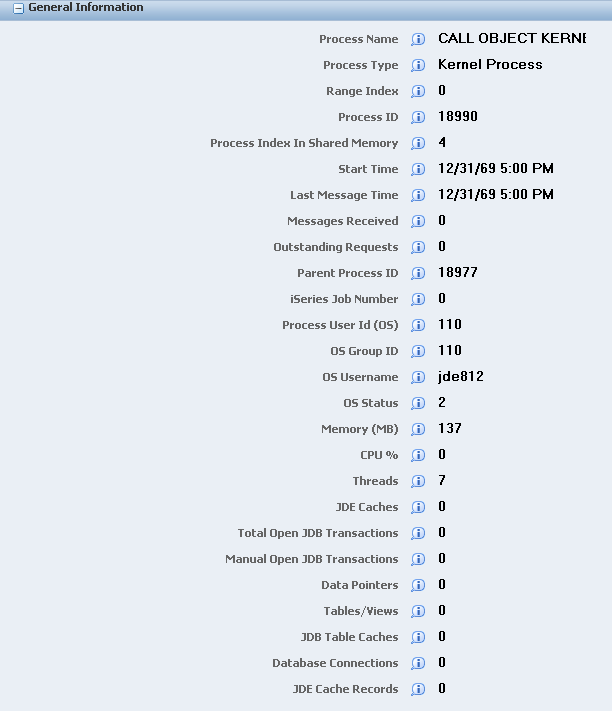
The items in the General Information section are:
Field |
Description |
|---|---|
Process Name |
The name of the kernel process. The name indicates which kernel definition the kernel belongs to. |
Process Type |
The description of the Enterprise Server process type. |
Kernel Range |
The kernel definition index. The Enterprise Server is composed of kernels that process messages from other servers and clients. There are more than thirty different types of kernels. The range index indicates which kernel group this kernel belongs to. |
Process ID |
The operating system assigned process identifier for the kernel process. |
Process Index In Shared Memory |
An internal identifier used to locate the process's position in the shared memory resources that track kernel and network processes. |
Start Time |
The time the process was created. |
Last Message Time |
The last time the kernel performed any activity such as processing incoming JDENET messages. |
Messages Received |
The total number of messages (requests) that have been processed by the kernel process. |
Outstanding Requests |
The number or requests that are queued and are waiting to be processed by the kernel process. |
Parent Process ID |
The operating system assigned process identifier of the parent process. |
IBM i Job Number |
The job number of the process, valid on the IBM i platform only. |
Process User ID (OS) |
The operating system user id under which the process is running. |
OS Group ID |
The group identifier of the os user running the process; valid only on unix based platforms. |
OS Username |
The operating system user name under which the process is running. |
OS Status |
The status of the process as reported by the operating system: 0 = Sleeping 1 = Running 2 = Stopped 3 = Zombie 4 = Other |
Memory (MB)* (applies to all E1 processes) |
The virtual memory usage in megabytes for the process. An increase in this value over time could indicate a leak that needs to be analyzed. |
CPU %* (applies to all E1 processes) |
The amount of %CPU consumed by EnterpriseOne server process. The %CPU is reported directly for SUN and HP platform and is a calculated value in WINDOWS, IBM i, AIX and LINUX platform. For example, on a 4-processor machine, a process using all of 1 CPU might be reported as using 25% or 100%. |
Threads* (applies to all E1 processes) |
The number of OS threads stared in the EnterpriseOne server process including any Java threads if the process loads a JDEJVM. |
JDE Caches* (does not apply to jdenet_n processes) |
The cache count for the process. This is the total number of JDE Caches in the EnterpriseOne server process which are opened by calling jdeCacheInit API. These caches are generally created by EnterpriseOne Business Functions. They are necessary for Business Functions to do their work. But an increase in this value over time could indicate a leak that needs to be analyzed. The application developer should call jdeCacheTerminate API in business function code to fix the JDECache leak. |
Total Open JDB Transactions* (does not apply to jdenet_n processes) |
The total number of open JDB transactions which includes both AUTO and MANUAL transaction. This resource is opened by calling JDB_InitUser API which is either called with JDEDB_COMMIT_AUTO or JDEDEB_COMMIT_MANUAL. An increase in this value over time could indicate a leak that needs to be analyzed. The application developer should call JDB_FreeUser API in business function code to fix the JDB Transactions leak. |
Manual Open JDB Transactions* (does not apply to jdenet_n processes) |
The number of MANUAL open JDB transactions are opened by calling JDB_InitUser API with JDEDEB_COMMIT_MANUAL. The number of manual open JDB transactions is directly linked with manual-commit database connections. This number should be zero in a normal environment. If this number is growing then it may result in database connection leaks and may cause the enterprise database to reach the maximum number of connections which will bring the entire EnterpriseOne environment (enterprise server and JAS servers) to a halt and consequently no EnterpriseOne user can get their work done. The application developer should call JDB_FreeUser API in business function code to fix the JDB Transactions leak. |
Data Pointers* (does not apply to jdenet_n processes) |
This reports the number of data pointer slots out of 1000 slots which are used by the current EnterpriseOne server job. The business function code calls jdeStoreDataPtr API to allocate a data pointer slot. The slot index starts at 1001 and goes till a maximum of 2000 for any enterprise server process. The data pointer leak should be fixed by the application developer in the business functions by calling jdeRemoveDataPtr API other wise they will eventually receive the hard error where the process will no not create any new data pointers. |
Tables/Views* (does not apply to jdenet_n processes) |
This report the number of JDB Table handles or JDB View handles opened in the EnterpriseOne server job. This resource is opened by calling JDB_OpenTable and JDB_OpenView API. The application developer should call JDB_CloseTable API to fix the table and view handle leaks. An increase in this value over time could indicate a leak that needs to be analyzed. |
JDB Table Caches* (does not apply to jdenet_n processes) |
This reports the number of JDB Table records cached in the EnterpriseOne server manager. The tables' records are cached when the table is registered in F98613 table using P98613 application or the application BSFN code called JDB_AddTableToCache API to cache the table records. If you are seeing lot of records cached then you might have a high memory usage issue in the EnterpriseOne server job. You should review the F98613 table and make sure you do not have any table which is added for caching by mistake. Also you should review if you have any new BSFN code which is calling the JDB_AddTableToCache API. |
Database Connections** |
The total number of open Database Connections includes AUTOcommit, Select For Update (SFU) and MANUAL-commit connections. An increase in this value over time could indicate a leak that needs to be analyzed. The AUTO and SFU connections have a small maximum limit whereas the MANUAL commit connections have no limit and can grow really high and will eventually hit the maximum global connections available in the database server. The manual commit open Database Connections are tied with the number of open manual commit jdb transactions. The next step should be to capture Memory Diagnostics or All Diagnostics from the server manager process detail page. The JDB transactions for different user sessions logged in the process should be reviewed and all of the open manual JDB transactions should be reviewed for a suspect where the apps BSFN code or tools code has called JDB_InitUser with MANUAL COMMIT MODE but has not called the JDB_FreeUser. The JDB transactions has the file name, line number and function name which should help the developer to locate the code faster and review if the specific code does not call JDB_FreeUser at all or does not call when the code returns with an error or exception path. |
JDE Cache Records** |
This is the total number of JDE Cache Records in the EnterpriseOne server process for the specific user which is created by calling the jdeCacheAdd API, for example. These cache records are generally created by EnterpriseOne Business Functions. They are necessary for Business Functions to do their work. But an increase in this value over time could indicate a leak that needs to be analyzed. The application developer should call the jdeCacheDelete (to delete cache records) or jdeCacheTerminate (to remove the entire cache) API in business function code to fix the JDE Cache Record leak. |
The items with an * have been added in the 8.98.2.0 release.
The items with an ** are new in the 8.98.3.0 release.