Resource Charts
The enterprise server process ID page has a new section called Resource Charts. The charts are available for all actively running EnterpriseOne server processes. The time-frame of the data collected will be indicated along the x-axis of the graphs. How much data is represented will depend on when the Server Manager Console services were started and the collection intervals for the monitors that were specified (refer to Configuration Setup).
The following two enterprise resource charts are applicable for all EnterpriseOne server process including JDENET_N, JDENET_K, RUNBATCH, PORTTEST etc.
Chart |
Description |
|---|---|
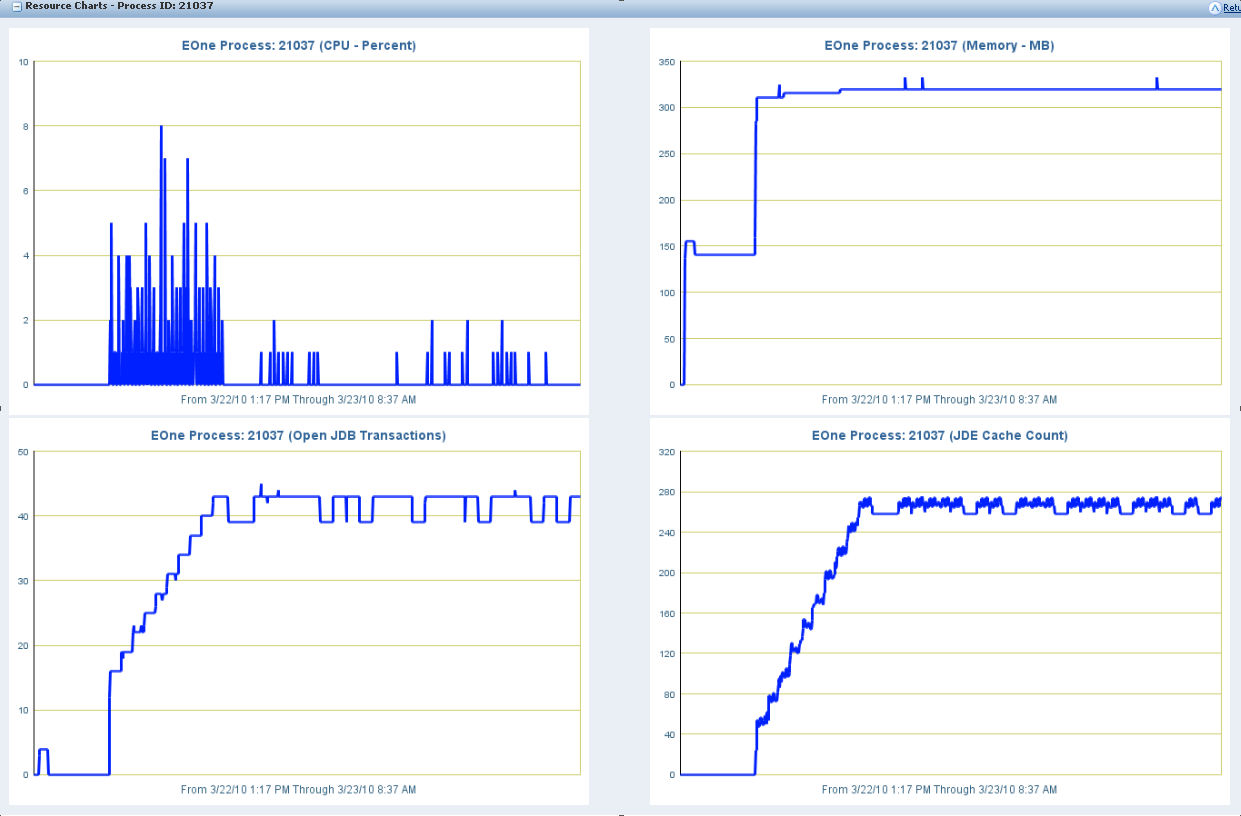
Eone Process: Process ID (CPU Usage - Percent) |
This chart reports the percent CPU used by this EnterpriseOne server process. If you see that a certain EnterpriseOne process is taking a lot of CPU over time like a CallObject kernel, you should then take CPU diagnostics to see if there is any looping pattern in a specific business function. It is normal for a RUNBATCH process to a take an entire CPU, so you should not bother about RUNBATCH unless the RUNBATCH process takes more than the normal execution time. If the percent CPU is low for a RUNBATCH process, it might be a hung RUNBATCH process and you should take CPU diagnostics to review if any specific business function is hung. |
Eone Process: Process ID (Memory - MB) |
This chart reports the memory used in megabytes by this EnterpriseOne server process. If you see an increasing trend in memory usage, then the process might be leaking memory. |
The following two enterprise resource charts are applicable to only non-jdenet_n EnterpriseOne server processes like JDENET_K, RUNBATCH, PORTTEST etc.
Chart |
Description |
|---|---|
Eone Process: Process ID (Open JDB Transactions) |
This chart reports the number of open JDB Transactions in the EnterpriseOne server process. If you see increasing number of open JDB Transactions then the process might be running business function code which is leaking JDB Transactions. |
Eone Process: Process ID (JDE Cache Count) |
This chart reports the number of open JDE Cache handles in the EnterpriseOne server process. If you see increasing number of open JDE Cache handles then the process might be running business function code which is leaking JDE Cache handles. |