Active Content EnterpriseOne Page for the Maintenance Scheduler Persona
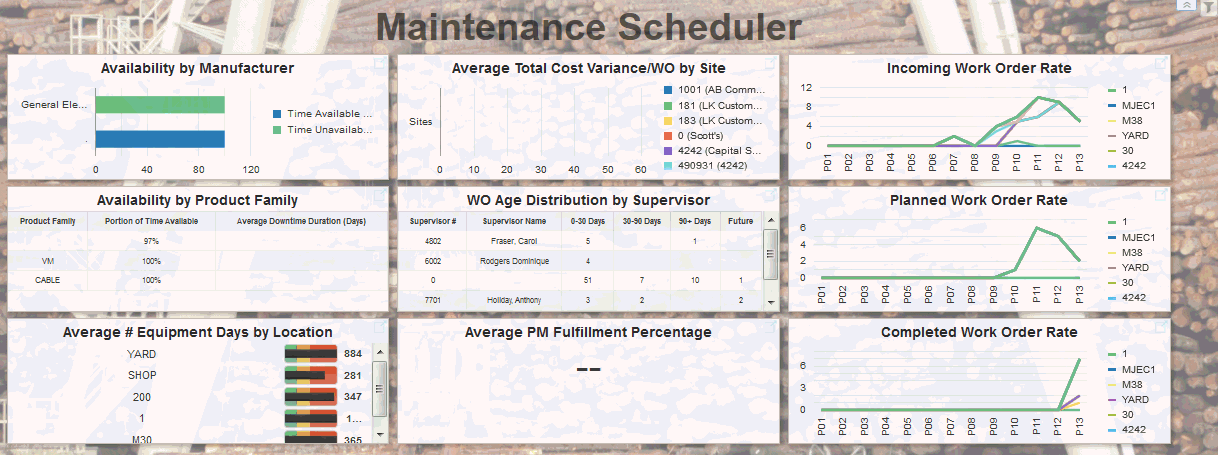
The Active Content EnterpriseOne Page for the maintenance scheduler includes information organized in tiles. You can set up the data that you want to view in the tiles by using the query functionality.

The following table describes the components of the Active Content EnterpriseOne Page available for the maintenance scheduler:
Component |
Component Type |
Description |
|---|---|---|
Availability by Manufacturer |
Graph |
This horizontal bar graph displays the percent of time available and unavailable for each equipment grouped by manufacturer. The data on this tile is based on the calculated grid columns for availability in the One View Equipment Status Inquiry program (P13400). |
Availability by Product Family |
Graph |
This table displays the average portion of time available for equipment grouped by product family. Additionally, you can view the average downtime duration (in days) for each product family. The data on this tile is based on the calculated grid columns in the One View Equipment Status Inquiry program (P13400). |
Average # Equipment Days by Location |
Graph |
This horizontal gauge chart displays, for each location, the average number of days that a piece of equipment spent time at the location. The green, yellow, and red color ranges indicate the thresholds for the number of days. The black bar in the middle of each horizontal gauge indicates the average number of days that the equipment spent at each location. The data on this tile is based on the calculated grid columns in the One View Equipment Location Inquiry program (P13230). |
Average Total Cost Variance/WO by Site |
Graph |
This horizontal bar chart displays the total estimated and total actual costs for work orders (parts, labor, other costs) by site. The data on this tile is based on the calculated grid columns for costs in the One View Work Order Analysis program (P13560). |
WO Age Distribution by Supervisor |
Graph |
This table displays the number of work orders that are 0-30 days old, 30-90 days old, over 90 days old, or scheduled for the future for each maintenance supervisor. The data on this tile is based on the calculated grid columns in the One View Work Order Analysis program (P13560). |
Average PM Fulfillment Percentage |
Graph |
You can view the average percentage of actual completion of maintenance (PM) orders compared to their schedule. The graph displays the average percentage of all equipment and PM services. For example, if a truck was scheduled to have its tires rotated 4 times a year and only 3 rotations have been completed, the PM fulfillment percentage for that service is 75%. The data on this tile is based on the calculated grid columns in the One View PM Analysis program (P13570). |
Incoming Work Order Rate |
Graph |
This line graph displays the monthly rate at which work orders are created for each business unit for the past 13 months. The Order Date is used to determine when work orders were created. The data on this tile is based on the calculated grid columns in the One View Work Order Analysis program (P13560). |
Planned Work Order Rate |
Graph |
This line graph displays the monthly rate at which work orders are planned to start for each business unit for the past 13 months. The Planned Start Date is used to determine when work orders were planned to start. The data on this tile is based on the calculated grid columns in the One View Work Order Analysis program (P13560). |
Completed Work Order Rate |
Graph |
This line graph displays the monthly rate at which work orders are completed for each business unit for the past 13 months. The Actual Finish Date is used to determine when work orders were completed. The data on this tile is based on the calculated grid columns in the One View Work Order Analysis program (P13560). |