Working with Object Usage Tracking Composed EnterpriseOne Page
The Object Usage Tracking Composed EnterpriseOne Page (CMP_1701270001JDE) presents four charts for you to use to analyze Object Usage Tracking data.
The Object Usage Tracking Composed Page is available for JD Edwards EnterpriseOne Applications Release 9.2 and later releases.
See the JD Edwards EnterpriseOne Tools Security Administration Guide to secure UDOs to system administrators only.
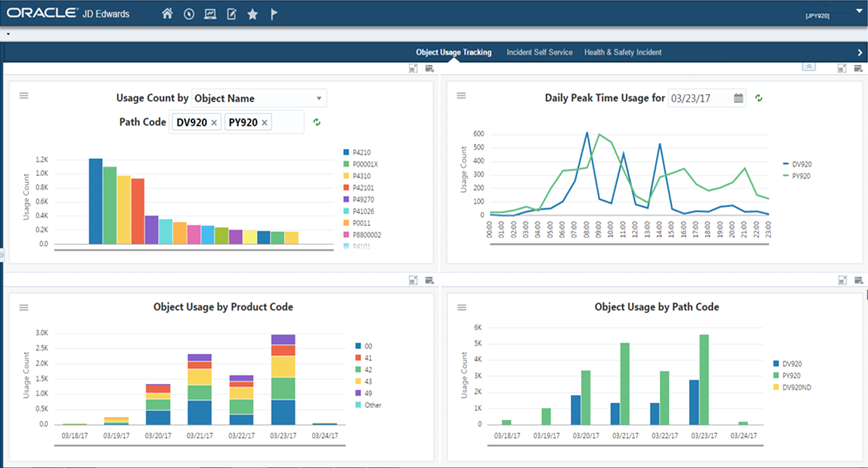
Usage Count by (Tracking Type) Chart
Use this chart to view object usage for the specified path code. The chart is based the Object Usage Tracking Summary table (F98902).
Additionally, you can use the drop-down menu on the top of the chart to change the data that the system displays. You can select one of the these options:
Object
Object/Form/Version
Product Code
You can use the menu to further filter the data in the chart that the system displays.
The queries associated with the object Usage Tracking Summary table are all filtering on Tracking Unit 01. Any query you create for use with this composite page must be filtering on one of the three tracking units. Tracking Unit 01 provides the most detail.
Daily Peak Time Usage for (Date) Chart
Use this chart to view daily object usage by path code. The chart is based over the Object Usage Tracking Summary table (F98902). You can use the input date field in the chart's title to change the date of the data displayed in the chart.
You can also use the menu to further change the data displayed in the chart.
The Path Code field determines which path code totals display on the chart. If you select multiple path codes, a separate line for each path code displays on the chart. If you do not select a path code, totals from all path codes in the F98902 are displayed in separate lines on the chart by default.
The Tracking Type field determines the type of summary totals displayed on the chart. For example, object usage totals may only be summarized in the F98902 by product code, so you will need to select the Product Code option from this field to view the data in the chart.
If the Universal Time setting in User Preferences is populated, the usage totals displayed on the chart will be adjusted to the account for your time zone offset. This will correctly display the hourly totals according to your day. Otherwise, all hourly totals on the chart are displayed according to Coordinated Universal Time (UTC) regardless of your time zone.
Object Usage by Product Code
Use this chart to view object usage totals by Product Code for a specified number of days. The chart is based over the Object Usage Tracking Detail table (F98911) and can show object usage totals for the past seven days.
You can use the menu to further change what data displays in the chart.
The Path Code field determines which path code totals display on the chart. If you select multiple path codes, product code totals for all selected path codes are combined into a single bar for each date. If you do not select a path code, usage totals for all path codes in the F98911 display on the chart by default.
The Number of Days field determines the number of dates appearing on the chart. You can select between one to seven days in the past.
The Display Count field determines the number of individual product code totals displaying on the chart. If the chart data contains totals for more product codes than the number specified, the totals beyond this number are accumulated and displayed under an "Other" category.
Object Usage by Path Code
Use this chart to view object usage totals by path code for a specified number of days. The chart is based over the Object Usage Tracking Detail table (F98911) and can show object usage totals for the past seven days.
You can use the menu to further change the data displaying in the chart.
The Path Code field determines which path code totals display on the chart. If you select multiple path codes, a separate totals bar for each selected path code displays on each date. If do not select a path code, usage totals for all path codes in the F98911 display on the chart by default.
The Number of Days field determines the number of dates appearing on the chart. You can select between one to seven days in the past.
These charts are based on the Object Usage Tracking Detail and Summary tables. By default, the charts are set up to render using predefined queries found in the chart's menu drawer. You can modify the queries to better meet your requirements. Additionally, you can add filters in the menu of each chart to further restrict the chart's data. The filters provide selection capabilities based on the columns included in the primary table used by each chart. For example, with the Daily Peak Time Usage chart, you can display hourly totals for a single object by creating a filter to only retrieve data where the F98902 Summary ID (OTSUM) column equals the name of the object.
The shared queries are:
All Supported Types (QRY98902_1702010003JDE)
Tracking Unit = 1
Applications (QRY98902_1701300005JDE)
Tracking Unit = 01
OMWOT = APPL
Applications and Reports (QRY98902_1701300008JDE)
Tracking Unit = 01
OMWOT = APPL or UBE
Reports (QRY98902_1701300006JDE)
Tracking Unit = 01
OMWOT = UBE
To limit irrelevant objects from appearing in the charts, you can add an exclude into the query, for example; SY not in (' ','H92','H95','H96U','H96B') and SYR not in (' ','00','UX'). This will limit some tools system codes that you may not want in your reporting.