UX One: Sales Page
The Sales page (P15001X|W15001XD) enables users to:
Receive alerts regarding the drop in monthly, quarterly, and yearly sales.
Analyze monthly sales and year-to-date sales.
Access programs to quickly and easily act on the information that is displayed on the page.
To access the UX One Sales page, log in to the EnterpriseOne system using the Property Manager role. When you log in with this role, the system automatically displays the Property Manager page. Click the Sales task on the springboard to access the Sales page.
This graphic illustrates the Sales page:
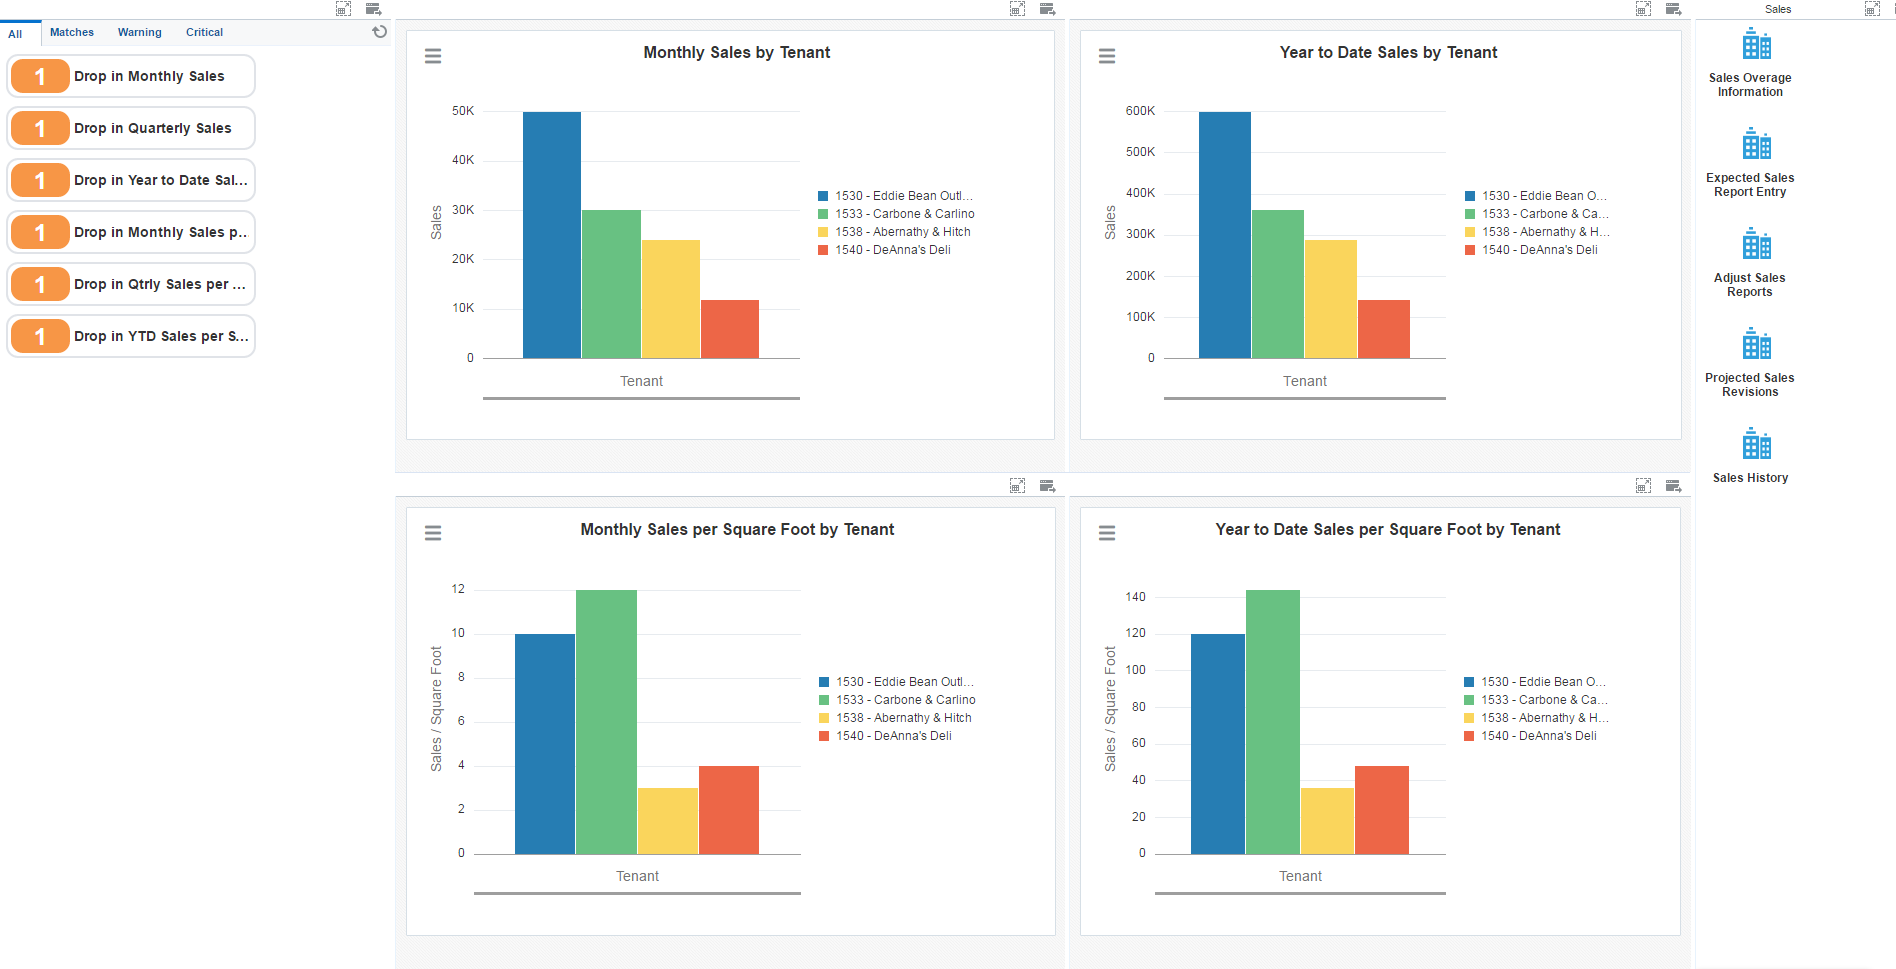
Watchlist Alerts
These alerts are based on EnterpriseOne programs. By default, the alerts are set up to use queries that are based on delivered demo data. Each of these queries is associated with a specific program version. To use a different query or call a different program version, you can modify these queries or create new queries that better meet your requirements. Additionally, these watchlists have been set up with specific warning and critical threshold values. You can adjust these values to meet your requirements.
This table lists and describes the watchlist alerts that are available on the Sales page:
Watchlist Alert |
Description |
|---|---|
Drop in Monthly Sales |
This alert tells users about the number of properties whose monthly sales has declined. This alert is based on the Work With Sales Analysis program (P15043). When you click the alert, the system displays the Work With Sales Analysis form. |
Drop in Quarterly Sales |
This alert tells users about the number of properties whose quarterly sales has declined. This alert is based on the Work With Sales Analysis program (P15043). When you click the alert, the system displays the Work With Sales Analysis form. |
Drop in Yearly to Date Sales |
This alert tells users about the number of properties whose year-to-date sales has declined. This alert is based on the Work With Sales Analysis program (P15043). When you click the alert, the system displays the Work With Sales Analysis form. |
Drop in Monthly Sales Per Sq Ft |
This alert tells users about the number of properties whose monthly sales per square foot has declined. This alert is based on the Work With Sales Analysis program (P15043). When you click the alert, the system displays the Work With Sales Analysis form. |
Drop in Qtrly Sales per Sq Ft |
This alert tells users about the number of properties whose quarterly sales per square foot has declined. This alert is based on the Work With Sales Analysis program (P15043). When you click the alert, the system displays the Work With Sales Analysis form. |
Drop in YTD Sales per Sq Ft |
This alert tells users about the number of properties whose year-to-date sales per square foot has declined. This alert is based on the Work With Sales Analysis program (P15043). When you click the alert, the system displays the Work With Sales Analysis form. |
For additional information about the programs associated with these watchlist alerts, see Analyzing Sales in the JD Edwards EnterpriseOne Applications Real Estate Management Implementation Guide.
Charts
These charts are based on EnterpriseOne programs. By default, the charts are set up to render using queries that are based on delivered demo data. Each of these queries is associated with a specific program version. To use a different query or call a different program version, you can modify these queries or create new queries that better meet your requirements.
This table lists and describes the charts that are available on the Sales page:
Component Title |
Description |
|---|---|
Monthly Sales by Tenant (P15043X|W15043XA) |
Use this chart to review monthly sales by various tenants. This chart is based on the Work With Sales Analysis program (P15043). |
Year to Date Sales by Tenant (P15043X|W15043XB) |
Use this chart to review year-to-date sales by various tenants. This chart is based on the Work With Sales Analysis program (P15043). |
Monthly Sales per Square Foot by Tenant (P15043X|W15043XC) |
Use this chart to review monthly sales per square foot by various tenants. This chart is based on the Work With Sales Analysis program (P15043). |
Year to Date Sales per Square Foot by Tenant (P15043X|W15043XD) |
Use this chart to review year-to-date sales per square foot by various tenants. This chart is based on the Work With Sales Analysis program (P15043). |
For additional information about the programs associated with these charts, see Analyzing Sales in the JD Edwards EnterpriseOne Applications Real Estate Management Implementation Guide.
Springboard Tasks
You use tasks to access EnterpriseOne programs and other UX One pages. These tasks are included in a springboard on the page.
This table lists and describes the tasks on the Sales page:
Task |
Description |
|---|---|
Sales Overage Information |
Use this task to access the Sales Overage Information - Work With Sales Information program (P15013). The following form layout is available:
The following grid format is available:
|
Expected Sales Report Entry |
Use this task to access the Expected Sales Report Entry - Work With Sales Entry program (P1540, version ZJDE0001). |
Adjust Sales Report |
Use this icon to access the Adjust Sales Report - Work With Sales Entry program (P1540, version ZJDE0002). |
Projected Sales Revisions |
Use this task to access the Projected Sales Revisions - Work With Projected Sales program (P15423). |
Sales History |
Use this task to access the Sales History - Sales History Inquiry program (P1541B). |
For additional information about the programs accessed by these tasks, see these topics in the JD Edwards EnterpriseOne Applications Real Estate Management Implementation Guide: