UX One: Service Cases Page
The Service Cases page (P17004X/W17004XA) enables users to receive alerts when cases associated with their team are escalated. The page also provides analytical data associated with case aging, commitments, and escalations.
To access the UX One Service Cases page, log in to the EnterpriseOne system using the Service Operations Manager role. When you log in with this role, the system automatically displays the Service Operations Manager page. Click the Service Cases task on the springboard to access the Service Cases page.
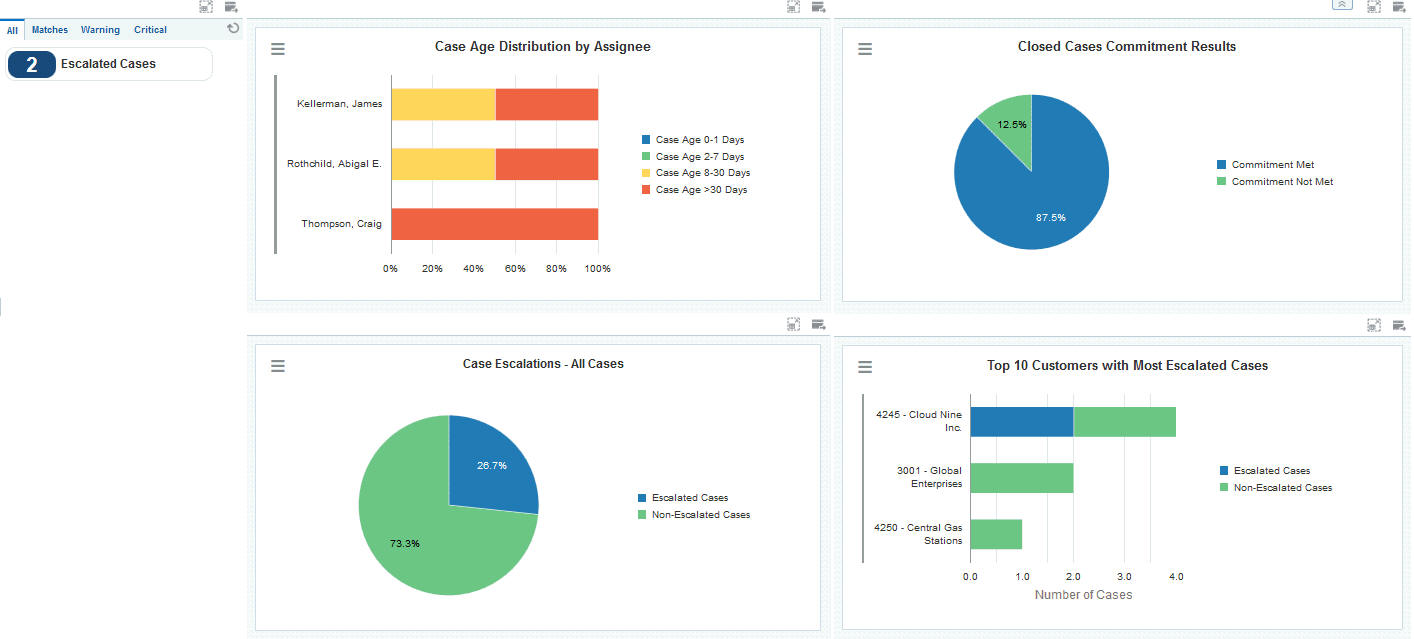
This graphic illustrates the Service Cases page:
Watchlist Alerts
These alerts are based on EnterpriseOne programs. By default, the alerts are set up to use queries that are based on delivered demo data. Each of these queries is associated with a specific program version. To use a different query or call a different program version, you can modify these queries or create new queries that better meet your requirements. Additionally, these watchlists have been set up with specific warning and critical threshold values. You can adjust these values to meet your requirements.
This table lists and describes the watchlist alerts that are available on the Service Cases page:
Watchlist Alert |
Description |
|---|---|
Escalated Cases |
This alert tells users how many escalated cases their team currently has. This alert is based on the Case Entry program (P17500). When you click the alert, the system displays the Work With Case Management form. |
For additional information about the programs associated with these watchlist alerts, see Entering Cases in the JD Edwards EnterpriseOne Applications Customer Relationship Management for Support Implementation Guide
Charts
These charts are based on EnterpriseOne programs. By default, the charts are set up to render using queries that are based on delivered demo data. Each of these queries is associated with a specific program version. To use a different query or call a different program version, you can modify these queries or create new queries that better meet your requirements.
This table lists and describes the charts that are available on the Service Cases page:
Component Title |
Description |
|---|---|
Case Age Distribution by Assignee (P90CG53X/W90CG53XN) |
Use this chart to view the aging distribution of cases on your team by assignee. This chart is based on the One View Case Management Inquiry program (P90CG530). |
Closed Cases Commitment Results (P90CG53X/W90CG53XF) |
Use this chart to view the commitment results for your team's closed cases. This chart is based on the One View Case Management Inquiry program (P90CG530). |
Case Escalations - All Cases (P90CG53X/W90CG53XM) |
Use this chart to view the percentage of current cases that are escalated. This chart is based on the One View Case Management Inquiry program (P90CG530). |
Top 10 Customers with Most Escalated Cases (P90CG53X/W90CG53XC) |
Use this chart to view the 10 customers that have the most escalated cases. This chart is based on the One View Case Management Inquiry program (P90CG530). |
For additional information about the programs associated with these charts, see One View Case Management Inquiry (P90CG530) in the JD Edwards EnterpriseOne Applications One View Reporting User Guide.