UX One: Service Operations Manager Page
The Service Operations Manager page (P17004X/W17004XD) enables users to receive important alerts about incidents, service alerts, contracts, and cases that might require attention. The page also provides analytical data about the profitability, case load, costs, and incidents associated with the team. Additionally, the page provides links to frequently used pages and programs.
To access the UX One Service Operations Manager page, log in to the EnterpriseOne system using the Service Operations Manager role.
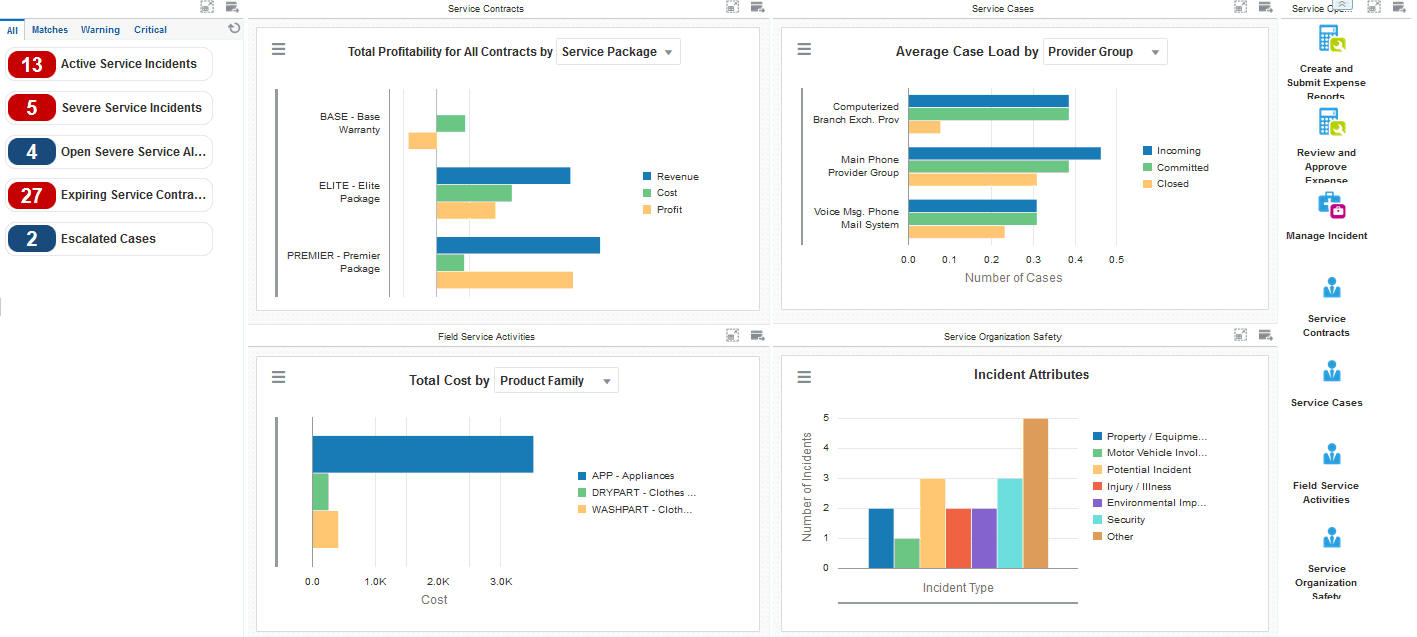
This graphic illustrates the Service Operations Manager page:
Watchlist Alerts
These alerts are based on EnterpriseOne programs. By default, the alerts are set up to use queries that are based on delivered demo data. Each of these queries is associated with a specific program version. To use a different query or call a different program version, you can modify these queries or create new queries that better meet your requirements. Additionally, these watchlists have been set up with specific warning and critical threshold values. You can adjust these values to meet your requirements.
This table lists and describes the watchlist alerts that are available on the Service Operations Manager page:
Watchlist Alert |
Description |
|---|---|
Active Service Incidents |
This alert tells users how many active service incidents their team currently has. This alert is based on the One View Incident Summary Inquiry program (P54HS220). When you click the alert, the system displays the One View Incident Summary Inquiry form. The following grid formats are available:
|
Severe Service Incidents |
This alert tells users how many severe service incidents their team currently has. This alert is based on the One View Incident Summary Inquiry program (P54HS220). When you click the alert, the system displays the One View Incident Summary Inquiry form. The following grid formats are available:
|
Open Severe Service Alerts |
This alert tells users how many open severe service alerts their team currently has. This alert is based on the Condition-Based Alerts Workbench program (P1310). When you click the alert, the system displays the Work With Condition-Based Alerts form. |
Expiring Service Contracts |
This alert tells users how many of the team's service contracts are going to expire soon. This alert is based on the Work With Contracts program (P1720). When you click the alert, the system displays the Work With Contracts form. The following form layouts are available:
The following grid formats are available:
|
Escalated Cases |
This alert tells users how many escalated cases their team currently has. This alert is based on the Case Entry program (P17500). When you click the alert, the system displays the Work With Case Management form. |
For additional information about the programs associated with these watchlist alerts, see:
One View Incident Summary Inquiry (P54HS220) in the JD Edwards EnterpriseOne Applications One View Reporting User Guide
Working with Condition-Based Alerts in the JD Edwards EnterpriseOne Applications Condition-Based Maintenance Implementation Guide
Managing Contracts in the JD Edwards EnterpriseOne Applications Service Management Implementation Guide
Entering Cases in the JD Edwards EnterpriseOne Applications Customer Relationship Management for Support Implementation Guide
Charts
These charts are based on EnterpriseOne programs. By default, the charts are set up to render using queries that are based on delivered demo data. Each of these queries is associated with a specific program version. To use a different query or call a different program version, you can modify these queries or create new queries that better meet your requirements.
This table lists and describes the charts that are available on the Service Operations Manager page:
Component Title |
Description |
|---|---|
Total Profitability for All Contracts by (P1730X/W1730XB) |
Use this chart to view total profitability for all contracts for your team. This chart is based on the One View Service Contract Profitability Inquiry program (P1730). Additionally, you can use the drop down menu at the top of the chart to display data by:
|
Average Case Load Per Period by (P90CG53X/W90CG53XB) |
Use this chart to view the average case load per period for your team members. This chart is based on the One View Case Management Inquiry program (P90CG530). Additionally, you can use the drop down menu at the top of the chart to display data by:
|
Total Cost by (P13560X/W13560XP) |
Use this chart to view total cost by contract for your team. This chart is based on the One View Work Order Analysis program (P13560). Additionally, you can use the drop down menu at the top of the chart to display data by:
|
Incident Attributes (P54HS22X/W54HS22XD) |
Use this chart to view the total number of incidents for your team. This chart is based on the One View Incident Summary Inquiry program (P54HS220). |
For additional information about the programs associated with these charts, see these topics in the JD Edwards EnterpriseOne Applications One View Reporting User Guide:
Springboard Tasks
You use tasks to access EnterpriseOne programs and other UX One pages. These tasks are included in a springboard on the page.
This table lists and describes the tasks on the Service Operations Manager:
Task |
Description |
|---|---|
Create and Submit Expense Reports |
Use this task to access the Expense Entry program (P09E2011, version ZJDE0002). |
Review and Approve Expense Reports |
Use this task to access the Expense Entry program (P09E2011, version ZJDE0003). |
Manage Incident |
Use this task to access the Incident Master program (P54HS00, version ZJDE0001). The following grid format is available:
|
Service Contracts |
Use this task to access the Service Contracts UX One page. |
Service Cases |
Use this task to access the Service Cases UX One page. |
Field Service Activities |
Use this task to access the Field Service Activities UX One page. |
Service Organization Safety |
Use this task to access the Service Organization Safety UX One page. |
For additional information about the programs accessed by these tasks, see:
Entering Expense Reports and Revising and Approving Expense Reports in the JD Edwards EnterpriseOne Applications Expense Management Implementation Guide
Entering and Managing Incidents in the JD Edwards EnterpriseOne Applications Health and Safety Incident Management Implementation Guide