Log All SAW Processes Callstack (9.2.6)
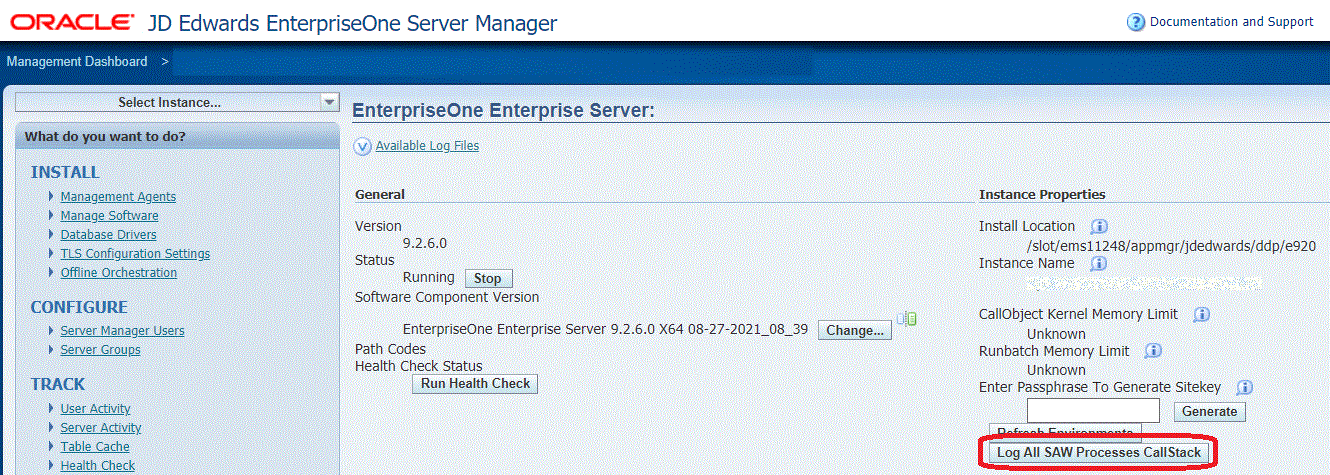
Enhanced logging functionality is invoked by clicking the Log All SAW Processes Callstack button for an Enterprise Server instance. This deep diagnostic tool can be used to determine the root cause for why a kernel did not respond as expected to a broadcast message that was sent by an on-demand refresh, or has other outstanding requests that are not being addressed. Potential reasons for unresponsive kernels are that they are deadlocked, looping, or in some other similar undesirable zombie state. This diagnostic function is not necessarily restricted to debugging kernel refreshes; it can be helpful to debug any suspected kernel anomaly.
Logging SAW process callstacks creates a log with a snapshot of each active kernel process, including associated threads, in their current state at the point in time that this function executes.
A practical debugging use case might be to take multiple snapshots over time and compare the callstacks to the expected function.
This section contains these procedures:
-
Logging the callstack for all SAW Processes
-
Logging the callstack for a Specific SAW Process on Linux
-
Logging the callstack for a Specific SAW Process on Microsoft Windows
-
Logging the callstack for a Specific Process ID on IBMi
Logging the callstack for all SAW Processes
-
Use Server Manager to select an Enterprise Server.
- In the Instance Properties section, click the Log All SAW Processes CallStack
button.
 Note: The snapshot includes the callstack of every active kernel and every thread within that kernel. Therefore, depending the volume of threads in your environment, the entire process can take some time.
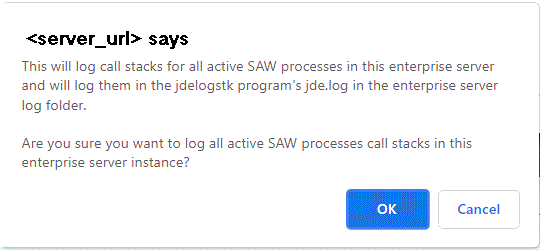
 - The following dialog is displayed.

- Review the content of the dialog which states:
This will log call stacks for all active SAW processes in this enterprise server and will log them in the jdelogstk program's jde.log in the enterprise server log folder.
Are you sure you want to log all active SAW processes in this enterprise server instance?
- Click the OK button to begin the processes to log all callstacks.
-
Note:
The resulting log files are named:
jdelogstk.xnn. For example,jdelogstk.c42.
Logging the callstack for a Specific Process ID on Linux
-
Open a command prompt.
-
Change directory to the
bin64directory within the JD Edwards EnterpriseOne installation directory.cd <E1 ES Install Folder>/system/bin64/For example:
cd /slot/ems12345/appmgr/jdedwards/ddp/e920/system/bin64 -
Launch the jdelogstk program using the following command:
jdelogstk <pid of JD Edwards EnterpriseOne process>For example:
> jdelogstk 727 -
The command returns a message indicating it completed successfully and also indicates the location of the log file.
For example:
Logged call stack for process id <727>Logged call stack in /slot/ems12345/appmgr/jdedwards/ddp/e920/log/jde_67890.log - Below is an example of the contents for a generated log file:
-bash-4.2$ cat /slot/ems11248/appmgr/jdedwards/ddp/e920/log/jde_32329.log
32329/140335261185856 MAIN_THREAD Mon Apr 25 17:10:53.065597 jdelogstk.c47
#0 0x00007fc4b6452983 in __select_nocancel () from /lib64/libc.so.6
#1 0x00007fc4b820f7d6 in processAsyncEvent (thread=thread@entry=0, waitTime=5, waitTime@entry=0) at
netflow.c:711
#2 0x00007fc4b821fa45 in JDENET_RunNet (listenService=listenService@entry=0x7fff12bd8930,
username=username@entry=0x7fff12bd89b0, password=password@entry=0x7fff12bd8a30) at netpub.c:3614
#3 0x0000000000400ad1 in main (argc=1, argv=<optimized out>) at jdenet_n.c:144
32329/140335261185856 MAIN_THREAD Mon Apr 25 17:10:53.067705 jdelogstk.c57 Logged call stack for process id <31799>
Logging the callstack for a Specific Process ID on Microsoft Windows
-
Open a command prompt.
-
Change directory to the bin64 directory within the JD Edwards EnterpriseOne installation directory.
cd <E1 ES Install Folder>\system\bin64\For example:
cd \slot\ems12345\appmgr\jdedwards\ddp\e920\system\bin64 -
Launch the jdelogstk program using the following command:
jdelogstk <pid of JD Edwards EnterpriseOne process>For example:
C:\EnterpriseServer\system\bin64>jdelogstk.exe 7228 -
The command returns a message indicating it completed successfully and also indicates the location of the log
file. For example, if the above command is issued the console displays the following:
Logged call stack for process id <7228>
Logged call stack in C:\EnterpriseServer\log\jde_7228.log
5. Below are the contents of the log file generated in this example:
7940/7152 MAIN_THREAD Fri Apr 22 12:53:53.544001 jdelogstk.c47
- Below are the contents of the log file generated in this example:
7940/7152 MAIN_THREAD Fri Apr 22 12:53:53.544001 jdelogstk.c47
=====Call stack of thread 6964=====
NtOpenDirectoryObject! C:\Windows\SYSTEM32\ntdll.dll
0x746ddbd3.<nosymbols>! C:\Windows\SYSTEM32\USER32.dll
MsgWaitForMultipleObjects! C:\Windows\SYSTEM32\USER32.dll
_processAsyncEvent@8! C:\EnterpriseServer\system\bin32\jdenet.dll
_JDENET_RunNet@12! C:\EnterpriseServer\system\bin32\jdenet.dll
_WinMain@16! C:\EnterpriseServer\system\bin32\jdenet_n.exe
?invoke_main@@YAHXZ! C:\EnterpriseServer\system\bin32\jdenet_n.exe
?__scrt_common_main_seh@@YAHXZ! C:\EnterpriseServer\system\bin32\jdenet_n.exe
?__scrt_common_main@@YAHXZ! C:\EnterpriseServer\system\bin32\jdenet_n.exe
_WinMainCRTStartup! C:\EnterpriseServer\system\bin32\jdenet_n.exe
0x74846a14.<nosymbols>! C:\Windows\SYSTEM32\KERNEL32.DLL
0x76faa9ff.<nosymbols>! C:\Windows\SYSTEM32\ntdll.dll

=====Call stack of thread 1544=====
NtWriteFile! C:\Windows\SYSTEM32\ntdll.dll
0x74846a14.<nosymbols>! C:\Windows\SYSTEM32\KERNEL32.DLL
0x76faa9ff.<nosymbols>! C:\Windows\SYSTEM32\ntdll.dll

7940/7152 MAIN_THREAD Fri Apr 22 12:53:53.546001 jdelogstk.c57
Logged call stack for process id <7228>
Logging the callstack for a Specific Process ID on IBMi
Use the command syntax in this example to get the callstack for a specific process ID, with these assumptions:
- Kernel job number: 157619
- PID: 1832185
SBMJOB CMD(CALL PGM(PP926SYS20/JDELOGSTK) PARM('1832185'))
                JOB(JDELOGSTK)
After the job is submitted, the console displays the following to confirm the progress of the callstack logging.
1832185 Tue Apr 19 12:48:24.375624 netcfg.c316
Starting 64Bit Kernel of Type: QUEUE KERNEL
1832195/22030 MAIN_THREAD Tue Apr 19 12:55:18.066520 jdelogstk.c47
Generating Call Stack for PID 1832185 from PID 1832195 with 1 active threads out of 1 total threads
available
================================
PID/PSThread_ID: 1832185/3604
System Thread ID: 3604
Thread Name:
CALLSTACK:
Level Program Library Module Statement Procedure
0 QC2UTIL1 QSYS QC2MI3 0000000001 deq
1 JDEIPC PP926SYS20 MSG 0000000018 JDE_msgrcv
2 JDEIPC PP926SYS20 IPCSYSV 0000000011 receiveMessage
3 JDEIPC PP926SYS20 IPCPUB 0000000032 ipcGetQueueEntry
4 JDENET PP926SYS20 EXTMSGQ 0000000032 getExternalQueueEntry
5 JDENET PP926SYS20 NETQUEUE 0000000015 processKernelQueue
6 JDENET PP926SYS20 NETPUB 0000000041 JDENET_RunKernel
7 JDENET_K PP926SYS20 JDENET_K 0000000019 main
8 JDENET_K PP926SYS20 JDENET_K _C_pep
9 QP0ZPCPN QSYS QP0ZPCPN 0000000286 Qp0zNewProcess
10 QP0ZPCP2 QSYS QP0ZPCP2 _CXX_PEP__Fv
1832195/22030 MAIN_THREAD Tue Apr 19 12:55:18.075328 jdelogstk.c57
Logged call stack for process id <1832185>