Debug Orchestration Features
Debug Orchestrations enables you to track and inspect an orchestration on a step-by-step basis. You can debug an orchestration by setting breakpoints at strategic points throughout the orchestration and testing the orchestration until you find the problem. When you debug an orchestration and encounter a step at which the orchestration fails, you can view the output data, and inspect the live values of the variables used in that particular step.
You can repeatedly run the steps and view the variables of a specific step in an orchestration. By observing specific variables while the orchestration runs, you can isolate where the orchestration begins to fail and what exactly it is doing at that stage.
You can debug an orchestration by clicking the Debug button on the Run Orchestrations page. In the debug mode, the Orchestrator Studio renders a view of an orchestration in which you can set breakpoints. The Debug mode also contains the Debug Orchestration panel.
Debugging Orchestrations with Multiple Forms within a Form Request (Tools Release 9.2.26.0)
When you debug an orchestration that contains multiple forms within a form request, the system displays the number of forms present within that form request step on the orchestration diagram. Additionally, the system displays which forms were processed successfully and precisely on which form an error occurred, enabling you to identify the exact source of an error.
For example, the following screenshot shows an error on the third out of ten forms on the form request step and on the Debug Orchestration panel, the error indicates that the Tax ID cannot be blank for that form.
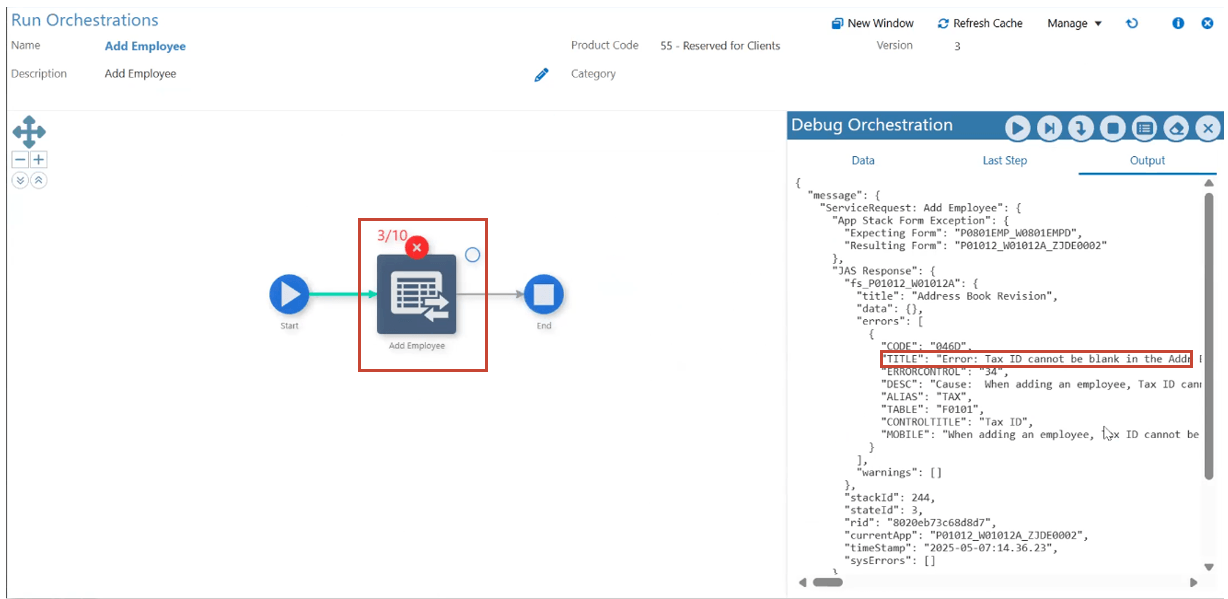
You can also click the Step Into button to process the Form Request form by form.
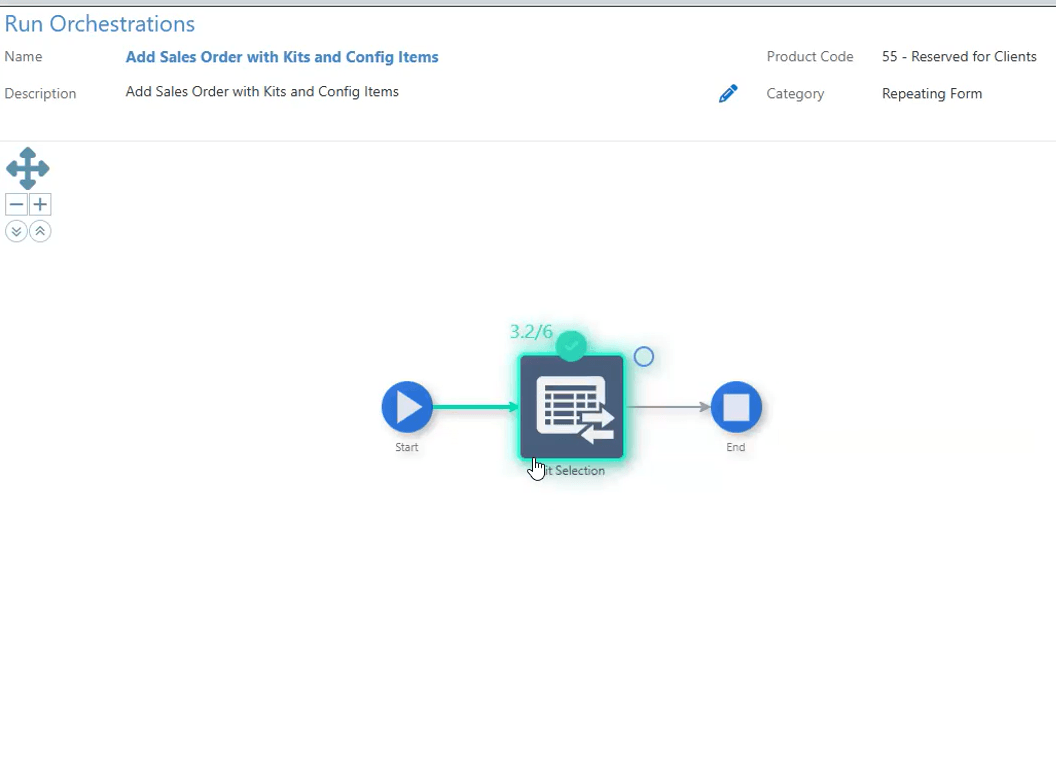
When you debug an orchestration that contains multiple iterations of a form within a form request, the system displays the iteration details on the orchestration diagram for that form request step.
For example, the following screenshot displays 3.2/6 in green, which means that out of the 6 forms in the orchestration, form 3 is currently being processed for the second time.
Debugging Orchestrations with File Inputs and/or Outputs (Tools Release 9.2.26.0)
You can now manage files to pass as input to the orchestration while debugging by using the Files button. The Files button is displayed on the slide-out panel when you click the Show/Hide Orchestration Inputs button on the Debug Orchestration panel.
Similar to when the orchestration is run from the Run Orchestrations page, if the orchestration you are debugging generates a file as output, it will be downloaded for review through the browser once the orchestration is processed (the End node is reached).
The options available on the Debug Orchestration panel are described in the following table:
|
Icons |
Description |
|---|---|
|
Run/Resume |
Runs an orchestration until completion unless you set up breakpoints. If you set breakpoints, this option processes an orchestration till the breakpoint is reached or resumes a suspended orchestration. |
|
Step Forward |
Runs the orchestration one step at a time. When a step has been processed successfully, a green check mark appears on the step. |
|
Step Into (Release 9.2.26.0) |
When debugging an orchestration containing a form request step with multiple forms, this button enables you to debug the Form Request form by form. When a form has been processed successfully, a green check mark appears on the step. The system also indicates if there is an error or a warning on the form step. |
|
Stop Orchestration |
Stops the processing of an orchestration. |
|
Show/Hide Orchestration Inputs |
Shows or hides the dialog box to enter or edit the initial orchestration inputs. (Tools Release 9.2.26.0) Displays the Files button on the slide-out panel, enabling you to drag and drop, or browse and upload files. The system updates the number next to Files on the button label depending on the number of files you upload. For example, if you upload two files, the button label is displayed as Files(2). Click the Run/Resume or Step Forward button to continue debugging the input files and verify the results in the Output tab. |
|
Clear All Breakpoints |
Removes all the breakpoints that you have set for the orchestration in the debug mode. |
|
Quit Debugging |
Exits Debug Orchestrations. |
For each step, the Debug Orchestration panel displays the following information:
Data
The Data tab displays all the available data that the orchestration consumes and generates, which includes the data that the orchestration consumes from a step. This tab displays the following information:
-
Step Variables. Displays all the variables created by the steps that have been processed. Variables from steps are added to the top of the list, so the most recent variables are shown at the top. Variables of single values like strings and numbers can be changed before resuming the orchestration. Variables containing arrays or JSON objects are read only.
-
Orchestration Inputs. Displays the values for inputs that were defined initially to start the orchestration.
-
Debug Overrides (Release 9.2.5). Displays the number of records to debug. Currently, the only override field is Debug Max Records and it displays the number of records to fetch from a Data Request or a Form Request grid while debugging. The default value is 10 and hence the system returns 10 records by default when you debug.
-
System Values. Displays the values for the default inputs: User Address Book Number, User Name, System Date, and Orchestration Input. The values for these inputs represent the originator of the orchestration when processed at runtime. The system values are not editable as these are fixed for an orchestration.
-
History. Displays a record of the values for a variable that is overwritten. For each overwritten variable, click the History icon displayed in its row. The History dialog box lists the orchestration steps where the specific variable is used along with the values. Similarly, the Output tab displays the history of the overwritten output values. (Release 9.2.4.4) The values and the history of inputs and variables are also available during the debug. You can also view the number of times the inputs and variables were changed after the orchestration started.
Last Step
Displays the outputs generated from the previous step that was processed in the orchestration.
(Tools Release 9.2.4.4) You can click the Raw Output button to view the complete response of the step in the JSON format.
(Tools Release 9.2.26.0) Displays the Transformation section with details about what values were passed into the step. The Name column shows all the values the step is expecting that are mapped in Transformations. The Variable column shows the orchestration input or variable from a prior step that is mapped in Transformations. The system will show a yellow alert if the mapped variable was not found during processing or a grey alert if the variable was not found but a default value was specified. The Value column shows the value of the variable, or the default value passed to the step.
Output
Displays the accumulative output generated for all the steps in the orchestration until the breakpoint.
Setting Breakpoints
Breakpoints enable you to define where or when to halt the processing of an orchestration. You use breakpoints to run the orchestration until it reaches a certain step.
In the debug mode, a blue circle appears to the right of the step in the orchestration flow. You can set a breakpoint by clicking either the blue circle or the step in the orchestration flow. A blue dot appears next to the orchestration step indicating that the breakpoint has been set.
If you set a breakpoint and click the Run/Resume icon on the Debug Orchestrations panel, the orchestration runs until it encounters that step. To continue processing after the breakpoint, you can use the Run/Resume or Step Forward icons on the Debug Orchestrations panel.