Testing the Logic Extension Using the Diagnostic Mode (Release 9.2.6.3)
Using the diagnostic mode, you can troubleshoot a logic extension by verifying the values of the variables, data structure items, and all system variables at each step.
To test your logic extension using the diagnostic mode, access the logic extension and in the Test tab, click the Test in Diagnostic Mode button. You can see that the executed path of your logic extension is highlighted in green. A number is displayed in a green field on the branch label of the While statement, Aggregation statement (Release 9.2.7) and every branch label of the If Else statement. The value displayed in each of these fields represents the number of times a branch is executed.You can hover over the branch label of If and While statements to view the detailed criteria without exiting the diagnostic mode.
When you hover over a step in the design panel, the corresponding steps are highlighted in the right panel. You can click a particular step in the design panel to filter and view only the corresponding steps in the right panel. To view all the steps again in the right panel, click the Show All button.
In the right panel, you can expand each step and verify the details(logs) at the execution level. The changed values are displayed in red and the unchanged values are displayed in black. Use the Previous and Next buttons to navigate across the execution path.
The system enables you to set the checkpoint for a step and then inspect the data at the
checkpoint  . If the value has changed during the execution of a statement, the information
 icon is displayed. Hover over the information icon to view the changes.
When there is no filter (statement or string filter), you can use the Previous and Next buttons to move the checkpoint backward or forward along the execution path and the system highlights the statement executed in the checkpoint entry. The step is expanded enabling you to inspect the details.
Starting with Tools Release 9.2.7.4, the system displays the Statement Detail view in diagnostic mode for all types of logic extension statements except for the While and Return statements. For the While and Return statements, the system displays only the All Data view.
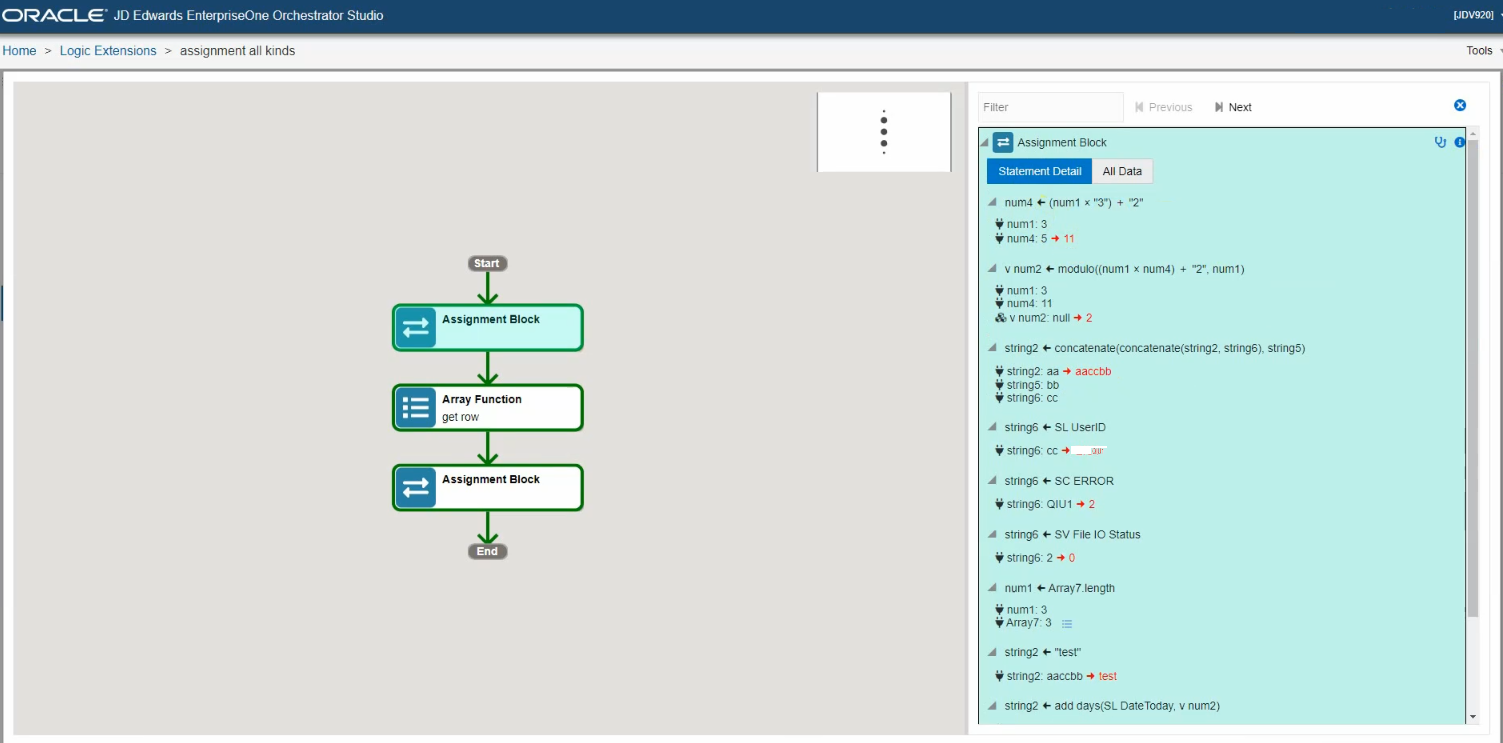
The Statement Detail view is displayed by default and you can toggle between the All Data and the Statement Detail views. In the All Data view, information about the data structure, variables, and system variables is listed.In the Statement Detail view, only the data related to the context of the particular statement is displayed.
For example, in the Statement Detail view of an Assignment statement, the system displays the name of the assignment, input and output parameter mappings, and related values. The related values are displayed in both the before and after states if the value has changed.
(Release 9.2.7) When you hover over an Aggregation statement in the design panel, the system highlights all the iterations of aggregation in the right panel. You can click the Aggregation statement in the design panel to filter and display only the corresponding aggregation iterations in the right panel. Expand the aggregation statements in the right panel to view the execution details.
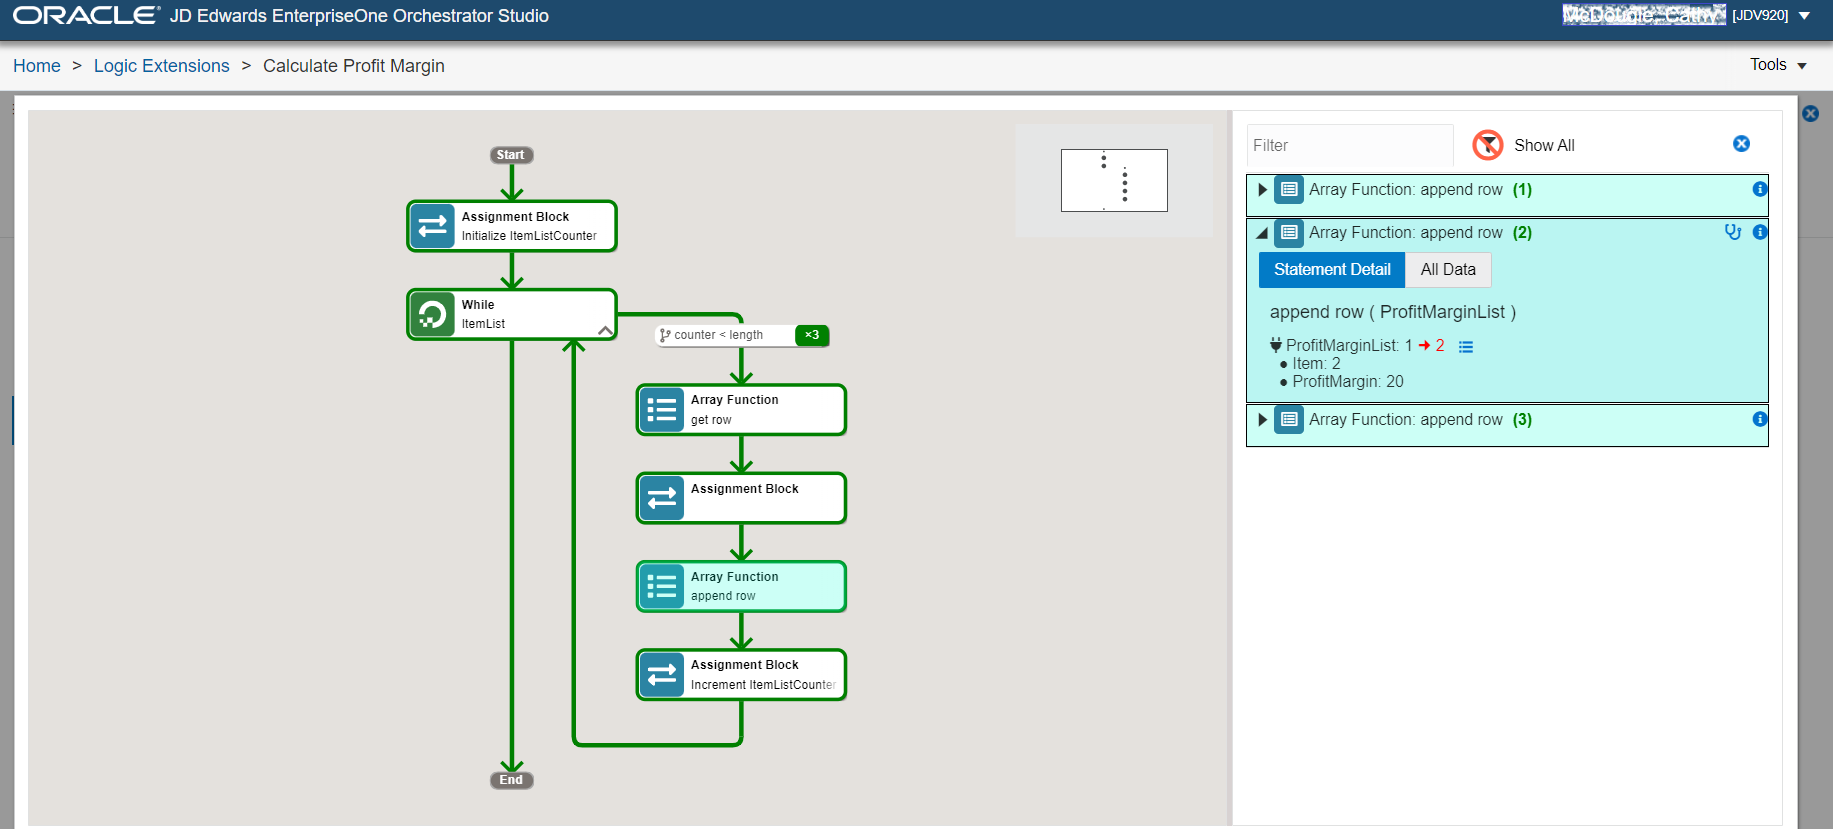
(Release 9.2.7) When you hover over an Array function in the design panel, the system highlights all the iterations of the array in the right panel. You can click the Array function in the design panel to filter and display only the corresponding array iterations in the right panel. Expand the Array functions in the right panel to view the execution details. The system displays the changes in red color.
For example, in the following screenshot, you can see details of the append row array function. The number 2 is highlighted in red to indicate that the second row is newly appended. When you click the Array (Show Detail) icon, a pop-up window with the array table is displayed. The newly appended array is displayed in red color.