Chart Subform
The chart subform includes two tabs: Display and Selection.
The Display tab of the Chart subform includes a graphical representation of the data in your user-defined columns. You can specify which columns to include in the graph by selecting the check boxes that correspond to the column names on these forms:
Column Layout form in the Project Status Inquiry Column Layout program (P51X91).
Work with Project Status Inquiry form (Columns 1–20 and Columns 21–40 tabs) in the Work with Project Status Inquiry program (P51X0200).
Project Status Inquiry form (Selection tab on the Chart subform) in the Project Status Inquiry program (P51X0210).
The system retains your column selections from the Project Status Inquiry Column Layout program to the Work with Project Status Inquiry program and then to the Project Status Inquiry program.
You can select up to 40 user-defined columns to include in your data selection, and you can display on the Display tab of the Chart subform up to 40 user-defined columns. Select or clear the check boxes next to the columns that you want to view or suppress and then click the Display tab to refresh the chart. You cannot select the check box for Visual Alert columns.
The check boxes for the columns include an orange square in the upper left corner of the check box. When you click on the square, the system opens a column information hover form that includes information such as the totaling method, whether as if currency is enabled for the column, and other factors.
See Column Information Hover Forms.
This image illustrates where you can select and modify column selections:
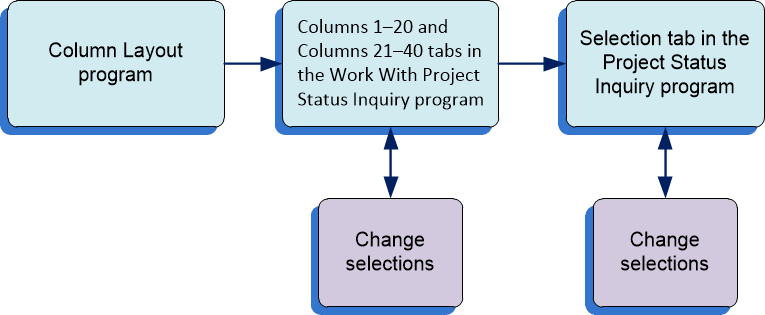
The system builds the chart only when one or more columns are selected in one of the programs that enable you to select the columns. The system displays the chart columns in the order in which they appear on the Columns 1–20 and Columns 21–40 tabs, which is also the order in which they appear on the Selection tab. The system displays the chart columns in system-determined colors. You cannot change the column order or the chart colors.
As you select different records in the Summary subform, the chart refreshes to show the data for the record that you selected.
You can set the Expand Chart Control Upon Entry processing option in the Work with Project Status Inquiry program (P51X0200) to display or suppress the expansion of the Charts subform when you first access the Project Status Inquiry form.