Incident Costs
Use this report to analyze the actual and estimated cost of an incident. This report contains the following components:
Actual Costs by Incident Type (horizontal bar graph)
Cost Variance by Incident Type (horizontal bar graph)
Average Actual Cost (gauge)
Top 10 Most Costly Incidents (vertical bar graph)
Actual Cost by Responsibility (pie chart)
Actual Cost by Severity (pie chart)
Actual Cost by Month (line graph)
Actual Cost by Year (line graph)
Actual Incident Costs by Establishment (vertical bar graph)
Actual Incident Costs by Business Unit (vertical bar graph)
Actual Incident Costs by Region (vertical bar graph)
Actual Incident Costs by Project (vertical bar graph)
Actual Incident Costs by Contractor (vertical bar graph)
Project Incident Summary Costs (By Establishment, Project) (table)
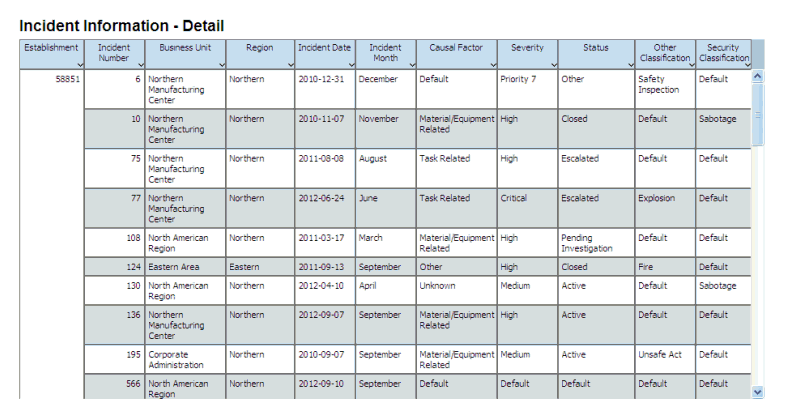
Incident Detail Costs (table)
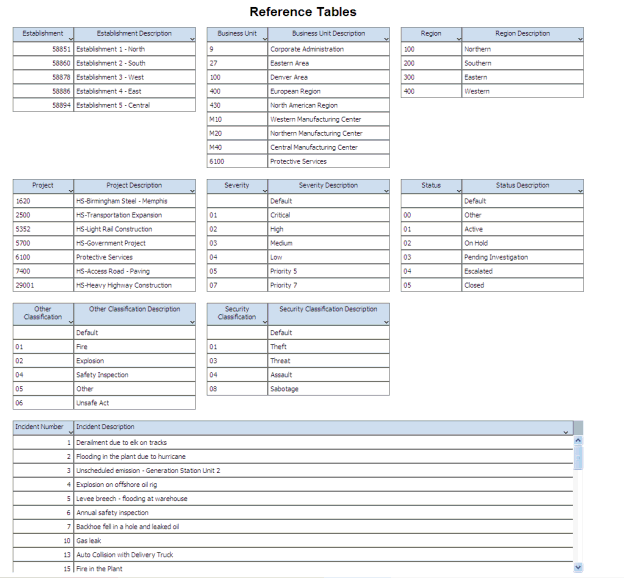
Reference tables with Establishment, Business Unit, Region, Project, Contractor, Severity, and Incident Number descriptions.
This report contains drill back functionality as described in the following table:
Functionality |
Value |
|---|---|
Table column containing drill back link |
Incident Number |
Table columns passed to application |
Incident Number |
Application called |
Incident Master (P54HS00) |
Form called |
W54HS00B |
Version called |
ZJDE0001 |