Pay History Analysis
This report provides a comprehensive pay detail analysis that includes elements such as total and percentage of earnings by company, business unit, and pay type. The Pay History Analysis report contains the following components:
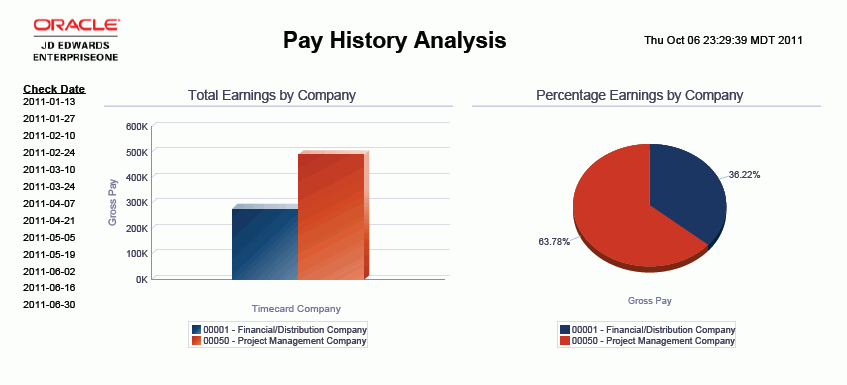
Total Earnings by Company (bar graph)
Percentage Earnings by Company (pie chart)
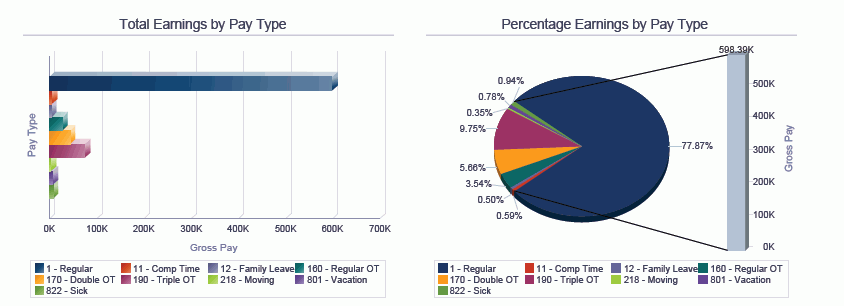
Total Earnings by Pay Type (horizontal bar graph)
Percentage Earnings by Pay Type (pie chart)
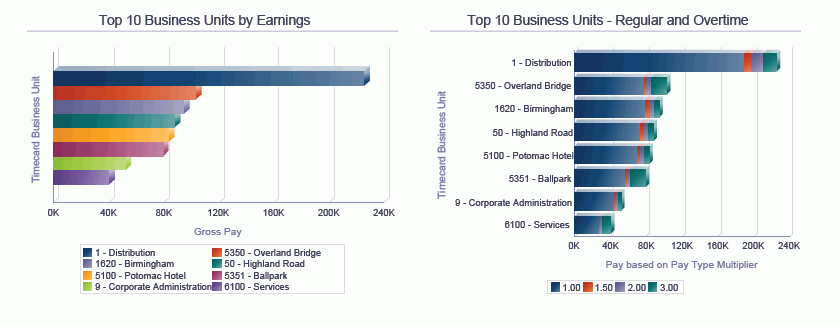
Top 10 Business Units by Earnings (horizontal bar graph)
Top 10 Business Units - Regular and Overtime (horizontal bar graph)
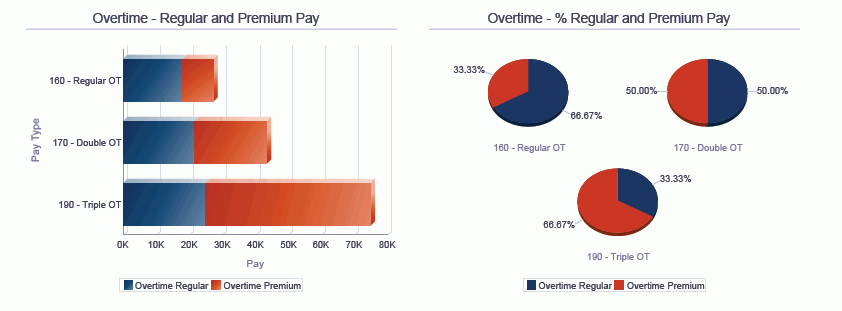
Overtime - Regular and Premium Pay (horizontal bar graph)
Overtime -% Regular and Premium Pay (pie charts)
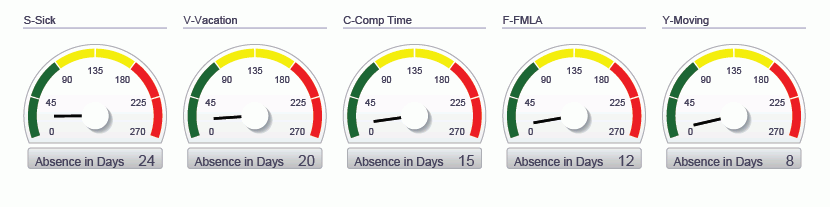
Absence in Days by Leave Type (gauges)
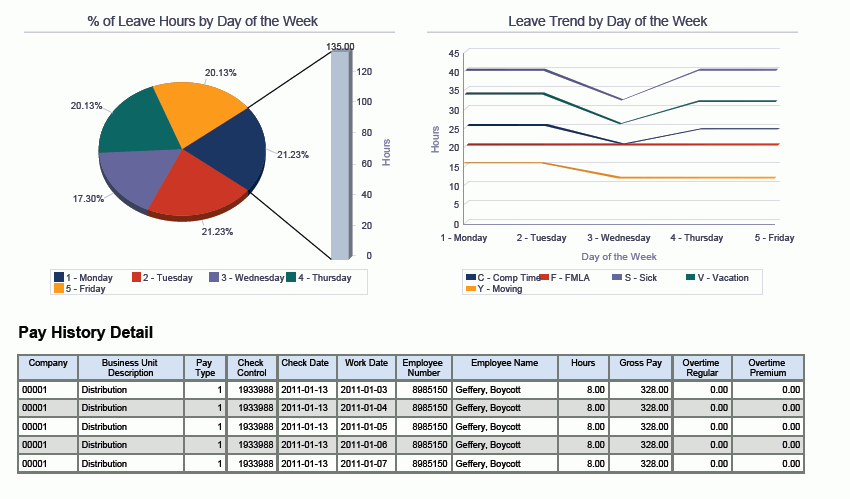
% of Leave Hours by Day of the Week (pie chart)
Leave Trend by Day of the Week (line graph)
Pay History Detail (table)
The Pay History Detail table component contains drill back functionality as described in the following table:
Functionality |
Value |
|---|---|
Table column containing drill back link |
Employee Number |
Table columns passed to application |
Employee No, PDBA Code, Year |
Application called |
PDBAs History (P079951) |
Form called |
W079951E |
Version called |
ZJDE0001 |
The following report was generated by querying pay history for all companies and pay types for a particular time period, such as a month, quarter, or year.