Receipt Analysis
This report enables you to do a full analysis of your receipt transactions. You can view your receipt transactions by collection manager, region (customer master category code 1), business unit, payor, and customer. You can analyze your entire organization or focus on a few business units, customers, regions, or collection managers. You choose the time frame and the group of receipt transactions to include in your analysis.
This report gives you complete control over the information shown in the graphs and table by providing filtering by Region (customer master category code 1). This report contains the following components:
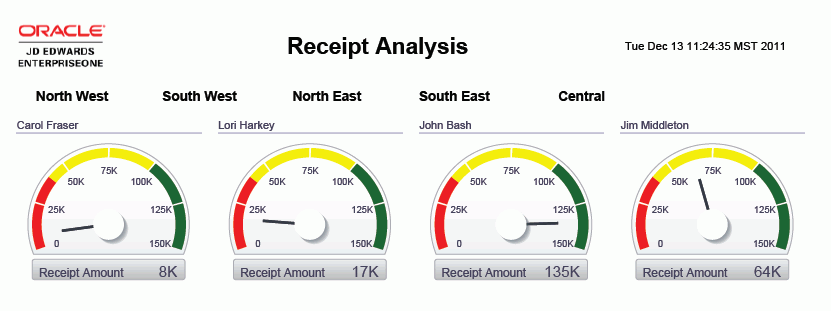
Receipt Amount by Collection Manager (gauges)
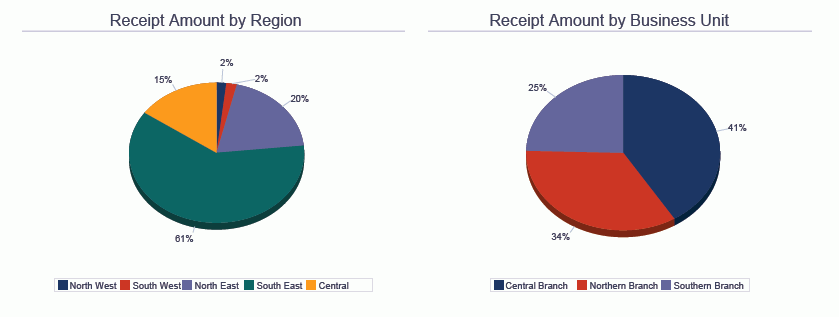
Receipt Amount by Region (pie chart)
Receipt Amount by Business Unit (pie chart)
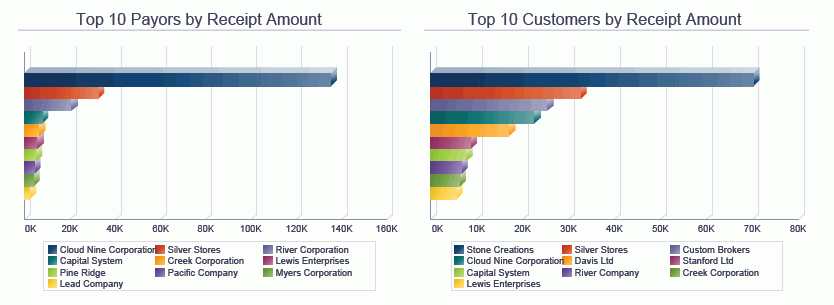
Top 10 Payors by Receipt Amount (horizontal bar graph)
Top 10 Customers by Receipt Amount (horizontal bar graph)
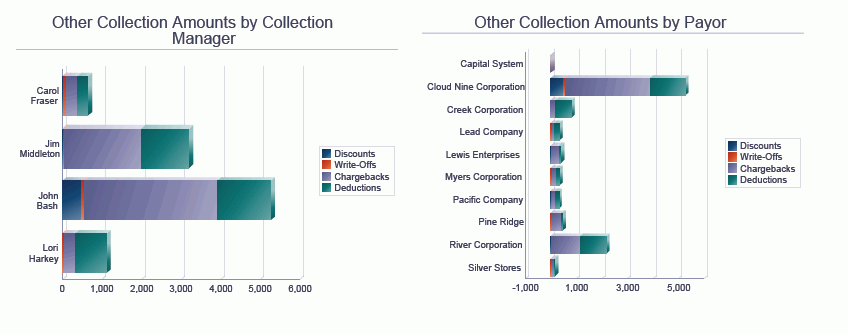
Other Collection Amounts by Collection Manager (horizontal bar graph)
Other Collection Amounts by Payor (horizontal bar graph)
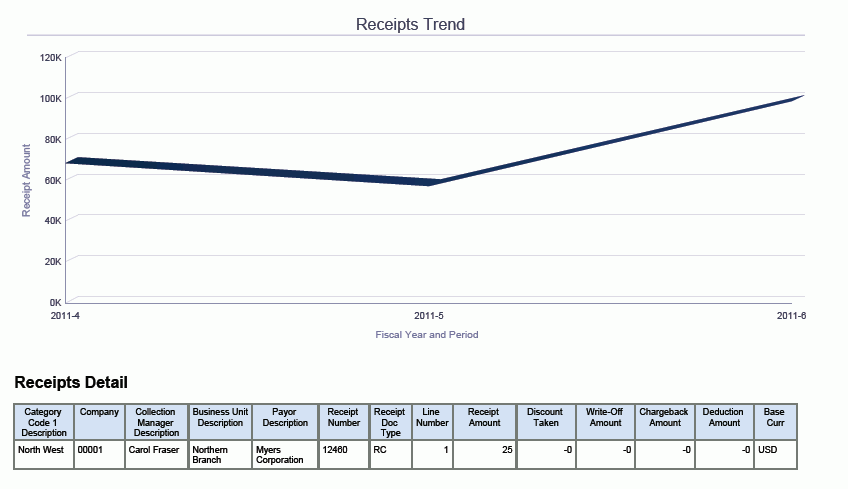
Receipts Trend (line graph)
Receipts Detail (table)
The Receipts Detail table component contains drill back functionality as described in the following table:
Functionality |
Value |
|---|---|
Table column containing drill back link |
Receipt Number |
Table columns passed to application |
Payment ID |
Application called |
Standard Receipt Entry (P03B102) |
Form called |
W03B102A |
Version called |
ZJDE0001 |
The following report was generated by selecting a large group of customers for company 00001 for periods four through six of fiscal year 11. It shows a broad view of the receipt activity across the periods.