Sales Price Analysis
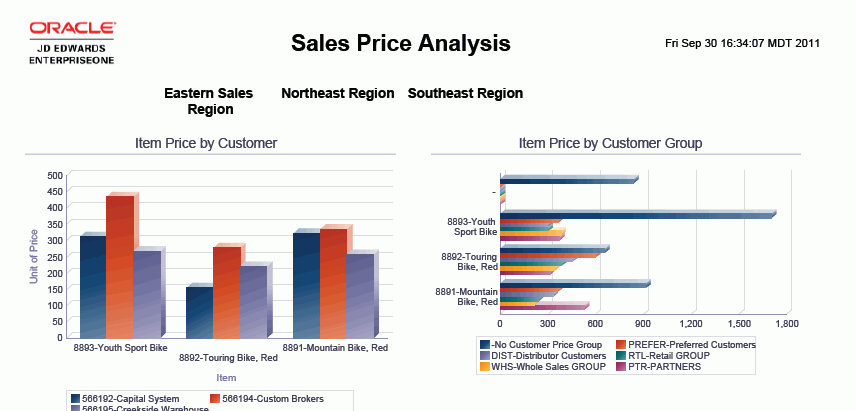
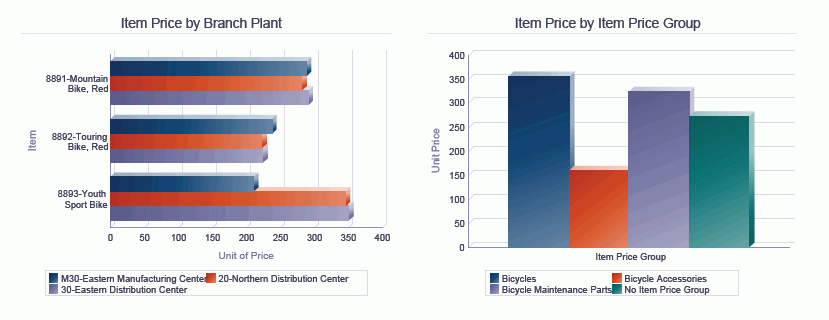
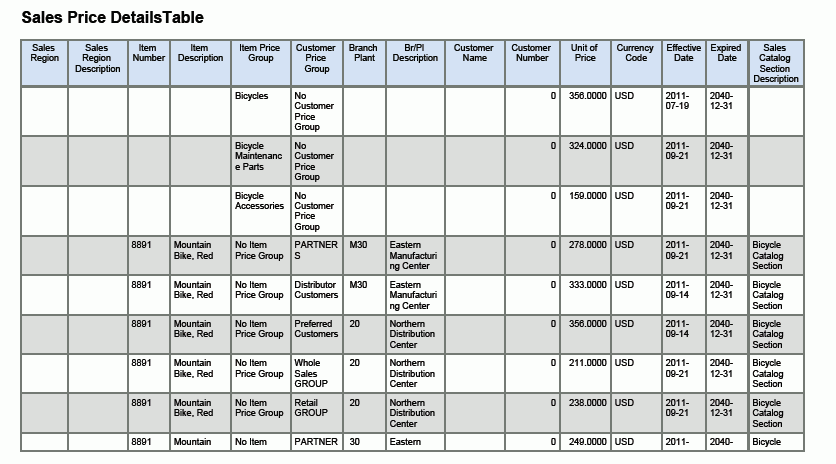
The Sales Price Analysis enables you to view the current base prices using region information as a filter. The Item Price by Customer cluster bar chart enables you to compare the unit price for items for customers within the selected region. The Item Price by Customer Group cluster bar chart enables you to compare the unit price for items for different customer groups within the selected region. The Item Price by Branch Plant cluster bar chart enables you to compare the unit price for items for different branch plants within the selected region. The Item Price by Item Price Group bar chart enables you to view the unit price for different item price groups within the selected region. The Sales Price Details Table displays all the base price records that were included in the selected region.
This report contains the following components:
Item Price by Customer (bar graph)
Item Price by Customer Group (horizontal bar graph)
Item Price by Branch Plant (horizontal bar graph)
Item Price by Item Price Group (bar graph)
Sales Price Details Table
The Sales Price Details table component contains drill back functionality as described in the following table:
Functionality |
Value |
|---|---|
Table column containing drill back link |
Item Number |
Table columns passed to application |
Item Number, Branch Plant |
Application called |
Base Price Revisions (P4106) |
Form called |
W4106J |
Version called |
None |